
Two weeks ago, I outlined a core bearish bias for crude oil prices while allowing for a potential short-term bounce. That bounce has now given way to a bearish reversal, offering bears a more favourable reward-to-risk setup. With positioning data and technical signals aligning, WTI futures may be on track for deeper losses towards $60 — or even the upper $50s if sentiment weakens further.
View related analysis:
- WTI Crude Oil Outlook: Bearish Momentum Mounts, COT Data Sends Warning
- Australian Dollar Outlook: Price Action Levels on AUD/USD, AUD/NZD
- Australian CPI Data Supports RBA’s Cautious Approach on Rate Cuts
WTI Crude Oil Outlook: Positioning and Technical Signals Point to $60 Downside
WTI Crude Oil Positioning (CL): Weekly COT Report Analysis
Bearish bets against crude oil continued to rise last week according to the latest Commitment of Traders (COT) report. More specifically, managed funds are their least bullish on crude oil since 16 years at just 27.5k contracts. Large speculators are net long by 120k contracts, though their bullish ness is also trending lower.
In both cases, gross shorts are rising and gross longs are falling. While it could be suggested that net-long exposure to crude oil among managed funds is at a sentiment extreme, their gross-short exposure is not. And they’re clearly lightening their bullish load in anticipation of lower prices, so for now my bias remains to fade into rallies and for cured oil to fall to at least $60, or possible the upper $50s should sentiment allow.
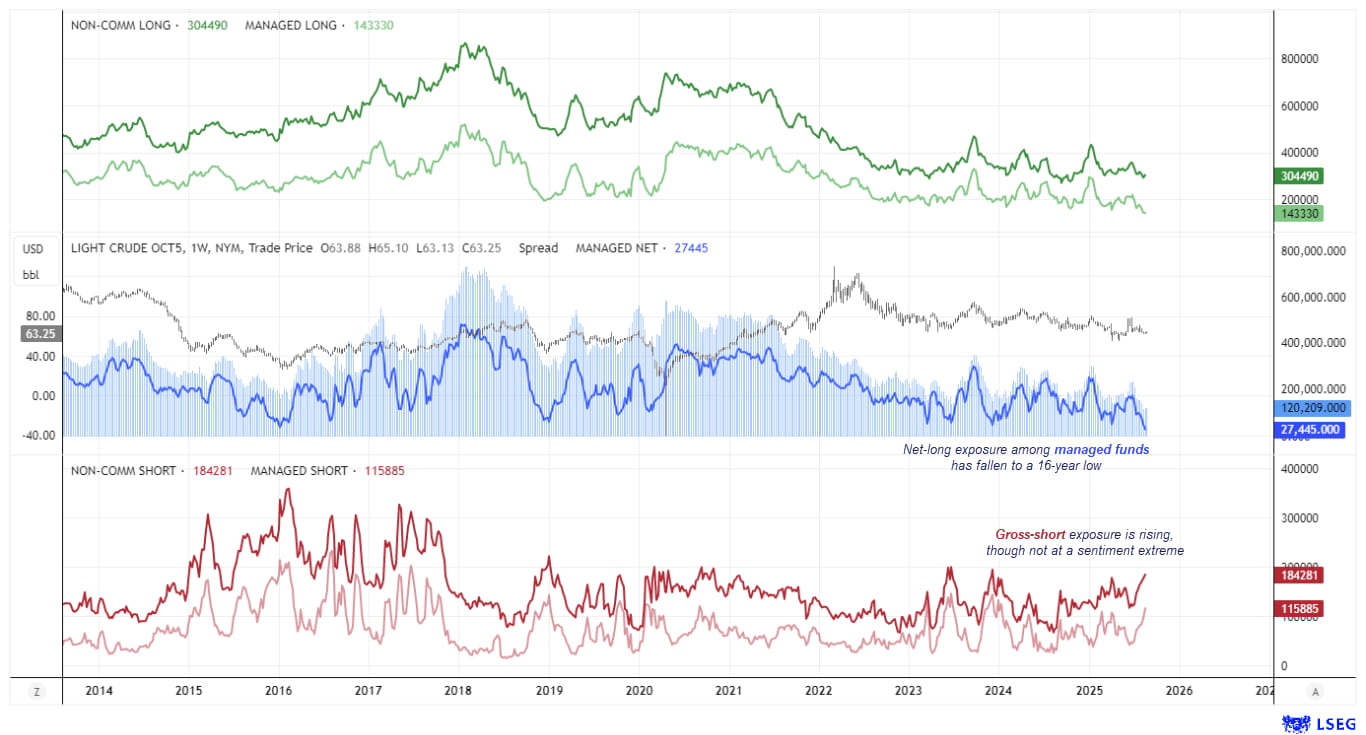
Chart analysis by Matt Simpson - data source: CME, LSEG
WTI Crude Oil Futures (CL) Technical Analysis – Daily Chart
The bounce in crude oil failed to reach the weekly VPOC (volume point of control) at 65.56, though it briefly tagged the $65 handle before bearish momentum took over. While not a textbook bearish engulfing candle, Tuesday’s session effectively acted like one — posting the most bearish range in over three weeks, with price closing near the day’s low.
Support has emerged at the 200-day SMA (63.23), raising the potential for a minor bounce within Tuesday’s range. However, the broader bias on the daily chart remains bearish while prices hold beneath Monday’s high (65.10). Bears now have the weekly VPOCs near $62.00 and $60.50 firmly in focus.
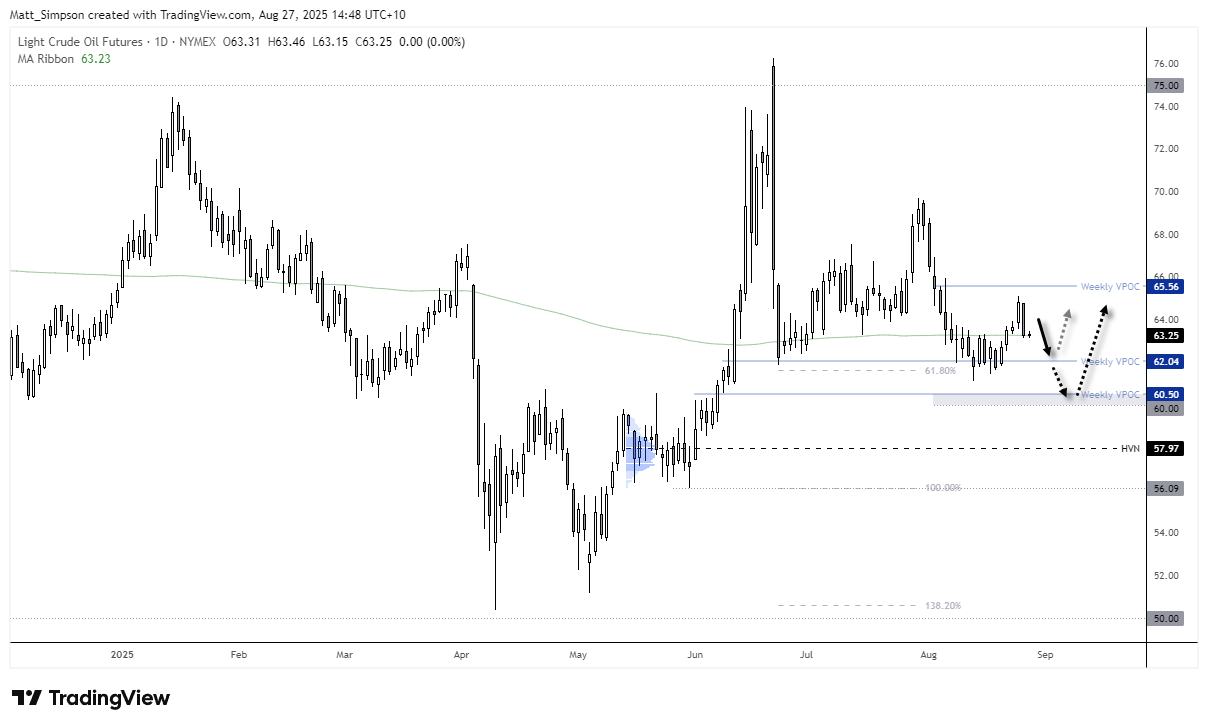
Chart analysis by Matt Simpson, Source: TradingView, ICE Futures, WTI Crude Oil
WTI Crude Oil Futures (CL) Technical Analysis – 1-Hour Chart
The 1-hour chart shows WTI crude oil attempting to build a base around $63.25, with the 200-day SMA, Thursday’s VPOC, and the weekly pivot clustered in the same zone alongside the $63 handle. A double bottom has also formed, accompanied by a 20-bar bullish reversal, hinting at scope for a minor bounce in the near term.
That said, bears may look for signs of a swing high beneath the $64.25 pinbar high as a signal to fade strength, with a break below $63 opening the way towards the $62.58 (Wednesday VPOC) and $62.04 (weekly VPOC) levels.

Chart analysis by Matt Simpson, Source: TradingView, ICE Futures, WTI Crude Oil
View the full economic calendar
-- Written by Matt Simpson
Follow Matt on Twitter @cLeverEdge
How to trade with City Index
You can trade with City Index by following these four easy steps:
- Open an account, or log in if you’re already a customer
• Open an account in the UK
• Open an account in Australia
• Open an account in Singapore
- Search for the market you want to trade in our award-winning platform
- Choose your position and size, and your stop and limit levels
- Place the trade