
The Japanese yen led the majors higher on Tuesday, supported by comments from Japanese officials and US Trade Secretary Scott Besset that eased fears of excessive fiscal stimulus from Japan’s new government. While the Bank of Japan (BOJ) is still expected to hold rates steady at 0.25%, Reuters reports policymakers may shift their focus toward future hikes — signalling a potential hawkish tilt.
Meanwhile, the Australian dollar was the second-strongest performer, with AUD/USD extending its rally on improved risk sentiment following constructive US trade talks with China and Japan, and hawkish remarks from Reserve Bank of Australia (RBA) Governor Michelle Bullock. She cautioned that a quarterly CPI print of 0.9% could derail expectations for a rate cut next week, sending RBA futures pricing for a 25bp cut down to 39% from 61%.
View related analysis:
- USD/JPY Hits Resistance, Implied Volatility Subdued Ahead of Fed, BOJ
- Australian Dollar Outlook: AUD/USD Eyes Volatility Ahead of Fed, AU CPI
- Nasdaq 100 Continues To Lead Wall Street Higher Ahead of Fed Decision
- ASX 200 Morning Market Outlook: CSL Plunge Drags ASX lower
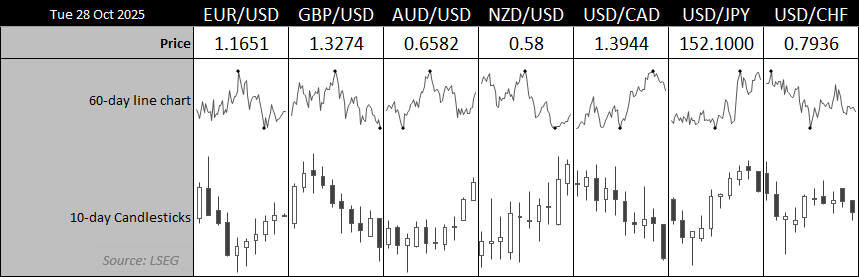
Chart prepared by Matt Simpson - data source: LSEG
Yen Strength Dominates FX as BOJ, RBA and Fed Loom
USD/JPY Technical Analysis: US Dollar vs Japanese Yen
Tuesday’s selloff signals a clear shift in momentum for USD/JPY, marking a confirmed double top around 153.28. The prospect of a stronger Japanese yen from this week’s Bank of Japan (BOJ) meeting, combined with potential US dollar weakness should the Federal Reserve adopt a dovish tone, could pave the way for further downside in USD/JPY heading into next week.
While the pair has found temporary support around its 10-day EMA and the weekly VPOC (volume point of control), a potential bear flag pattern is emerging on the 1-hour chart. Given the bearish momentum shift, traders may look to fade minor rallies within Tuesday’s range or wait for a decisive break below yesterday’s low to confirm continuation.
The next downside target sits near 151.00 at the weekly S1 pivot, with a break below this level bringing the key 150.00 handle into focus.
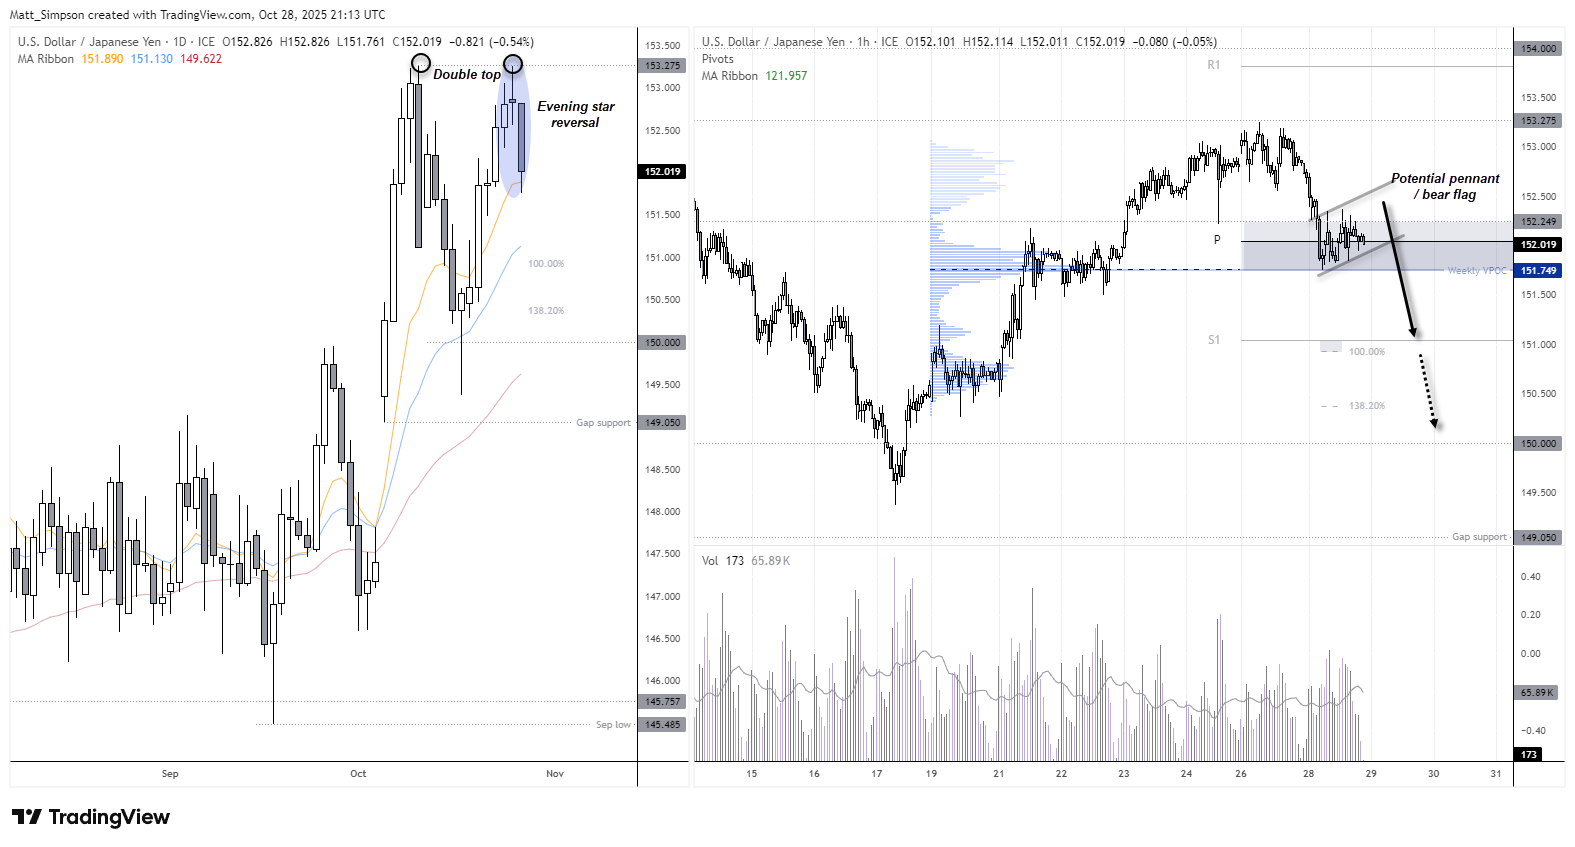
Chart analysis by Matt Simpson - data source: TradingView USD/JPY

AUD/JPY Technical Analysis: Australian Dollar vs Japanese Yen
Another yen pair to watch is AUD/JPY heading into today’s Australian CPI data. I suspect the figures won’t reach the 0.9% q/q threshold highlighted by RBA Governor Michelle Bullock — a result that could keep hopes of a rate cut alive next week and weigh on the Australian dollar.
A hammer candle has formed on the daily chart around the 100 handle, with Monday and Tuesday’s highs resembling a tweezer top (or a potential double top on lower timeframes). While there may be some wriggle room around this week’s highs, bears will likely look for confirmation of a false break above the tweezer top as a cue for a leg lower towards the January high near 99.17. A sustained move below 99.00 would open the door to a deeper pullback.
That said, a combination of softer Australian inflation and a hawkish Bank of Japan (BOJ) outcome would likely be needed to fuel a larger correction — unless broader risk-off sentiment provides an additional catalyst.
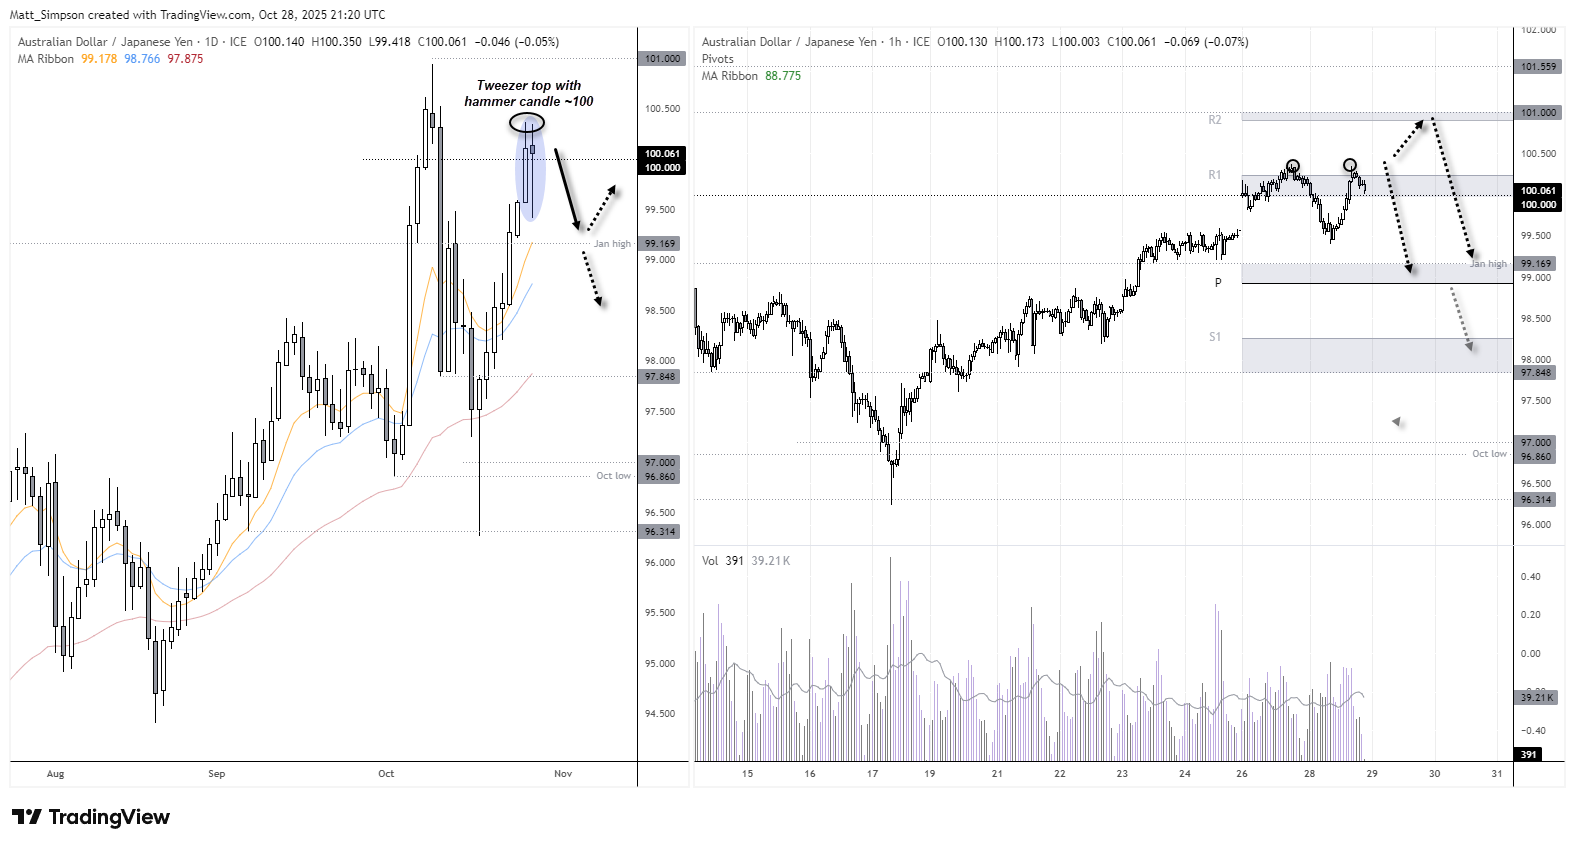
Chart analysis by Matt Simpson - data source: TradingView AUD/JPY

AUD/USD Technical Analysis: Australian Dollar vs US Dollar
Bulls remain firmly in control of AUD/USD, which is currently enjoying its best two-day rally in six weeks. However, with the Aussie nearing a cluster of resistance levels — and with CPI data unlikely to completely rule out an RBA cut next week — I’m leaning toward a short-term pullback.
The October VPOC, weekly R3 pivot, and monthly pivot point all converge just below 0.66. The fact that AUD/USD has reached its weekly R3 pivot in only two sessions also suggests the rally may be overstretched.
That said, I’m not anticipating a large sell-off by any means. But if the data cooperates, the Aussie could at least retrace toward its 1-hour 20- or 50-bar EMA to form a swing low and potentially offer bulls another opportunity to rejoin the trend.
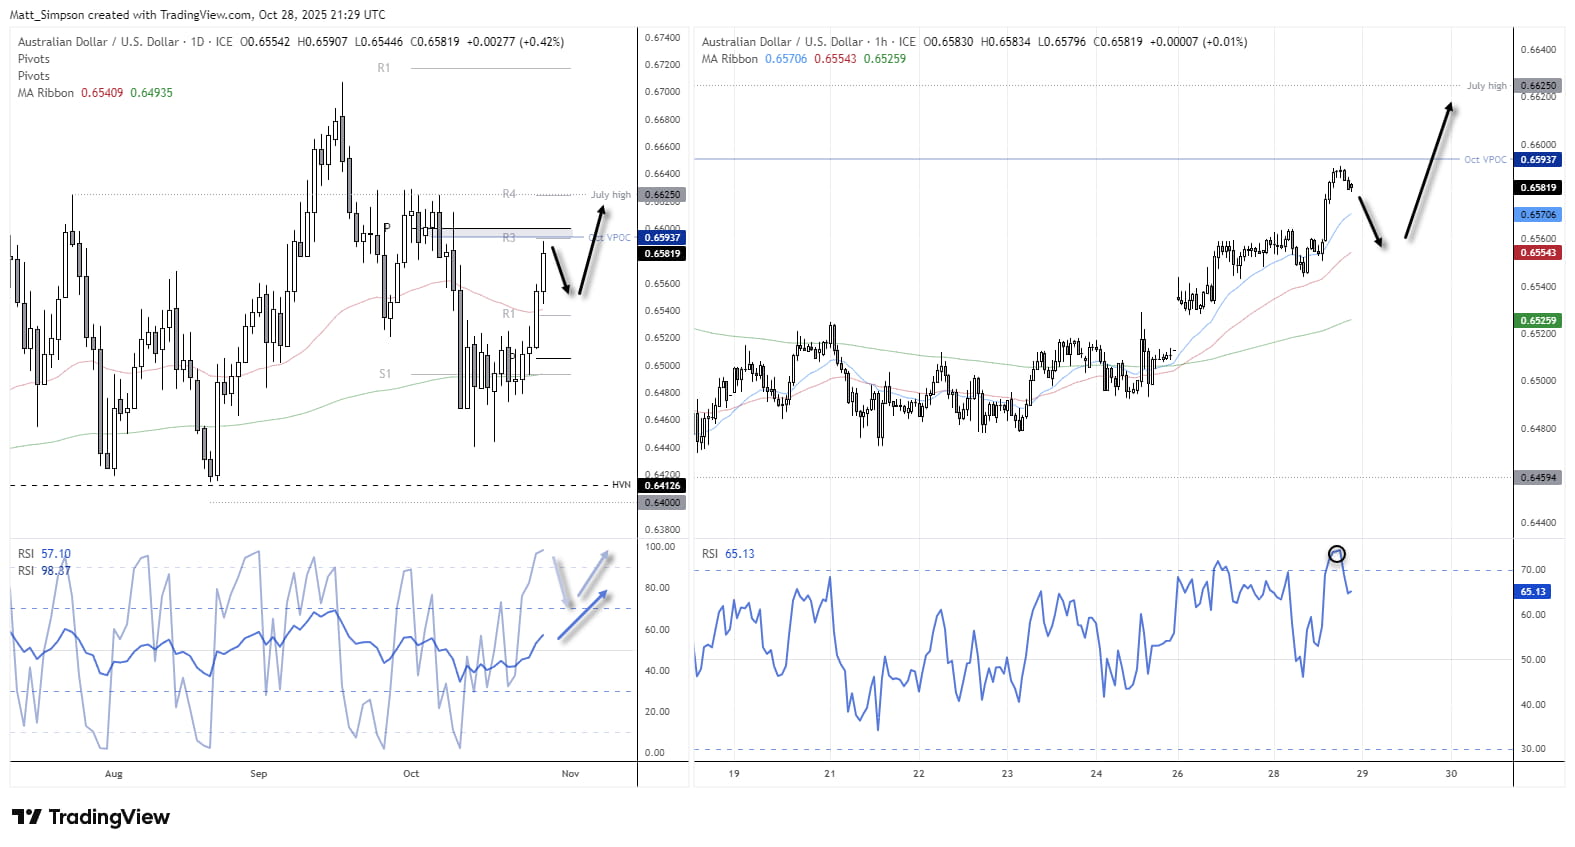
Chart analysis by Matt Simpson - source: TradingView AUD/USD
Key Economic Events for Traders (AEDT / GMT+11)
All Day Holiday Hong Kong – Chung Yeung Day (HKD, Hang Seng Index)
07:30 USD API Weekly Crude Oil Stock (WTI Crude, Brent Crude, USD/CAD)
11:30 AUD CPI, Trimmed Mean, Weighted Mean (Q3) (AUD/USD, AUD/JPY, ASX 200)
16:00 JPY Household Confidence (Oct) (USD/JPY, EUR/JPY, Nikkei 225)
18:00 NOK Core Retail Sales (Sep) (USD/NOK, EUR/NOK, Brent Crude)
20:00 CHF ZEW Expectations (Oct) (USD/CHF, EUR/CHF, SMI Index)
20:30 GBP Monetary & Credit Data: M3, M4, Mortgage Approvals, Net Lending (Sep) (GBP/USD, EUR/GBP, FTSE 100)
21:30 EUR German 10-Year Bund Auction (EUR/USD, EUR/GBP, DAX)
23:30 USD Goods Trade Balance, Retail & Wholesale Inventories (Sep) (S&P 500, Nasdaq 100, USD/JPY)
00:45 CAD BoC Interest Rate Decision, Policy Report & Statement (USD/CAD, CAD/JPY, S&P/TSX)
01:30 USD EIA Weekly Petroleum Report: Crude, Gasoline, Distillates, Refinery Utilization (WTI Crude, Brent Crude, USD/CAD)
01:30 CAD BoC Press Conference (USD/CAD, CAD/JPY, S&P/TSX)
02:30 USD Atlanta Fed GDPNow (Q3) (S&P 500, Nasdaq 100, USD/JPY)
05:00 USD FOMC Statement & Fed Interest Rate Decision (S&P 500, Nasdaq 100, USD/JPY)
05:30 USD FOMC Press Conference (S&P 500, Nasdaq 100, USD/JPY)