

View related analysis:
- AUD/USD Weekly Outlook: CPI, RBNZ, PCE - Key Data Ahead
- WTI Crude Oil Outlook: Bearish Risks Build as Traders Trim Longs
- Japanese Yen and VIX Rise as Wall Street Slips on Weak Bond Auction
- Gold Rally Stalls Below Monthly High: Is a Deeper Pullback Brewing?
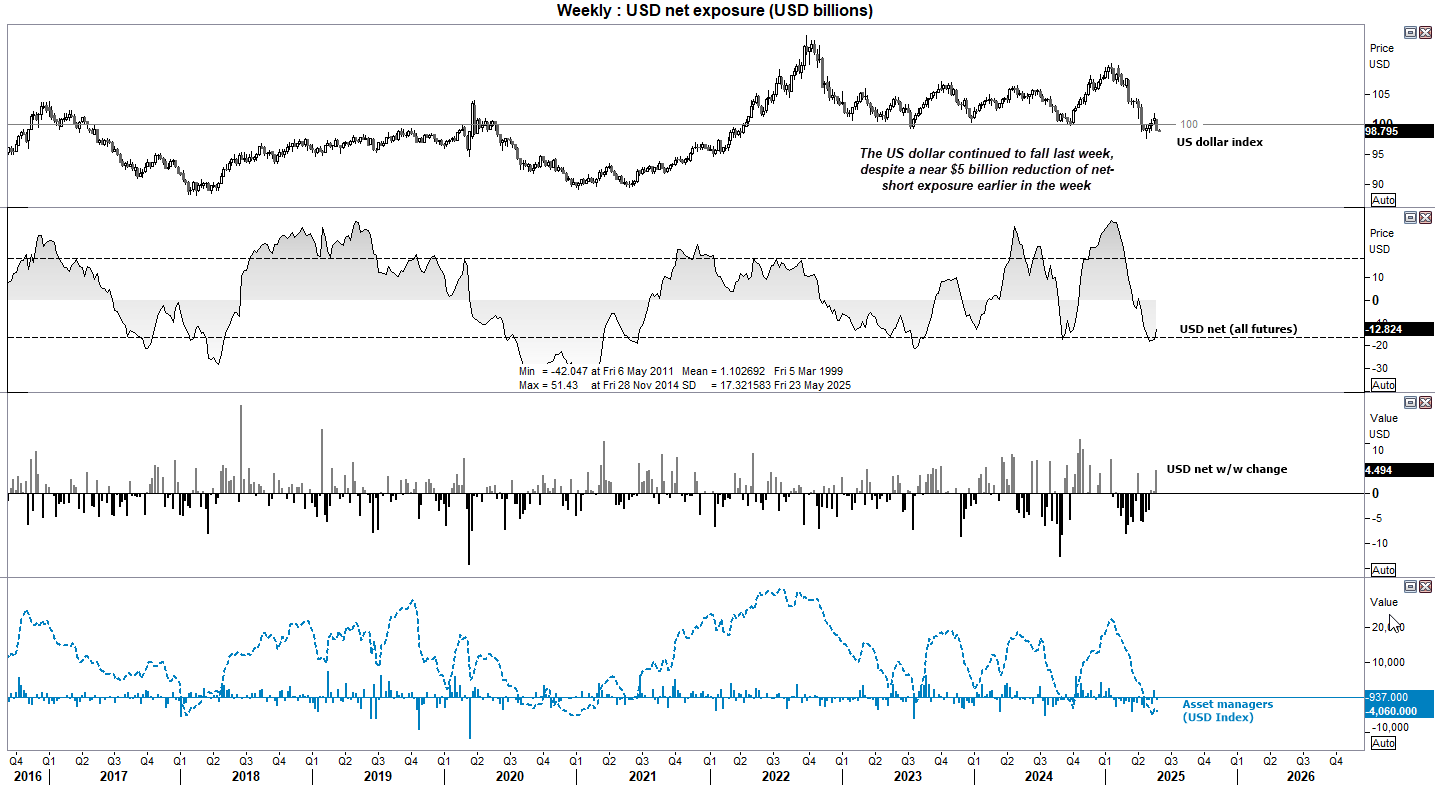
US Dollar Positioning (IMM Data): Weekly COT Report Analysis
The US dollar snapped a four-week winning streak by Friday’s close, with Trump’s announcement of 50% tariffs on EU goods providing the latest reason for traders to throw the dollar overboard. Interestingly, the latest data from the International Money Market (IMM) shows that traders had effectively reduced their net-short exposure to the USD by -$4.5 billion as of Tuesday.
We’ve seen net-short exposure curl higher from the lower one-standard deviation band. However, if Trump continues down his current path, the dollar could indeed move lower — which means we may need to factor in a -2 standard deviation move for bearish exposure to the US dollar.

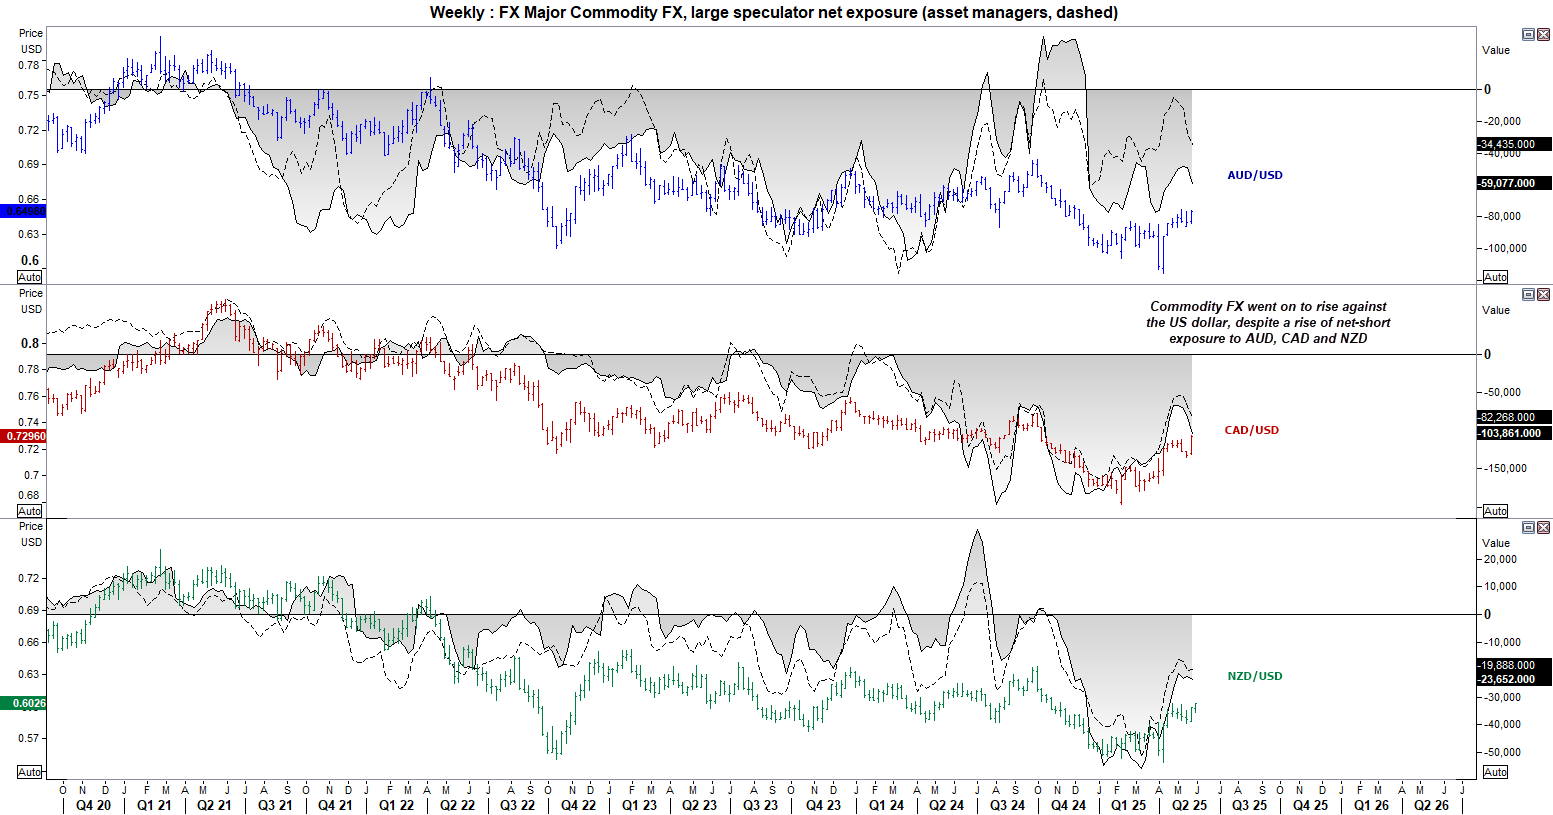
Commodity FX Positioning (AUD, CAD, NZD): Weekly COT Report Overview
Traders continued to increase their net-short exposure to commodity FX last week, though I suspect many may have regretted this move given the sharp sell-off in the US dollar on Friday. AUD/USD is on the cusp of breaking to a five-month high, NZD/USD bulls are on the verge of reclaiming 60c, and USD/CAD is probing a major trendline from the 2021 low.
Ultimately, all eyes are on the US dollar this week, as it could send commodity currencies much higher if the wheels truly fall off for the greenback.
Metals (Gold, Silver) Futures - COT report
For several months, I’ve watched the divergence between rising gold prices and falling net-long exposure to gold widen. But with gold prices remaining elevated and net-long exposure turning higher, perhaps bulls are ready to rejoin the party.
Managed funds increased their net-long exposure to gold futures for the first week in nine. Given that their bullish exposure has effectively halved since its 2024 peak, we should perhaps start factoring in the potential for a new record high in gold.
Traders also increased their net-long exposure to silver futures, and if gold breaks higher, it seems quite likely that silver will follow.
However, take note that gold bulls are on track to fail to break above the prior month’s high for the first time this year. The last time that occurred, a two-month correction followed.


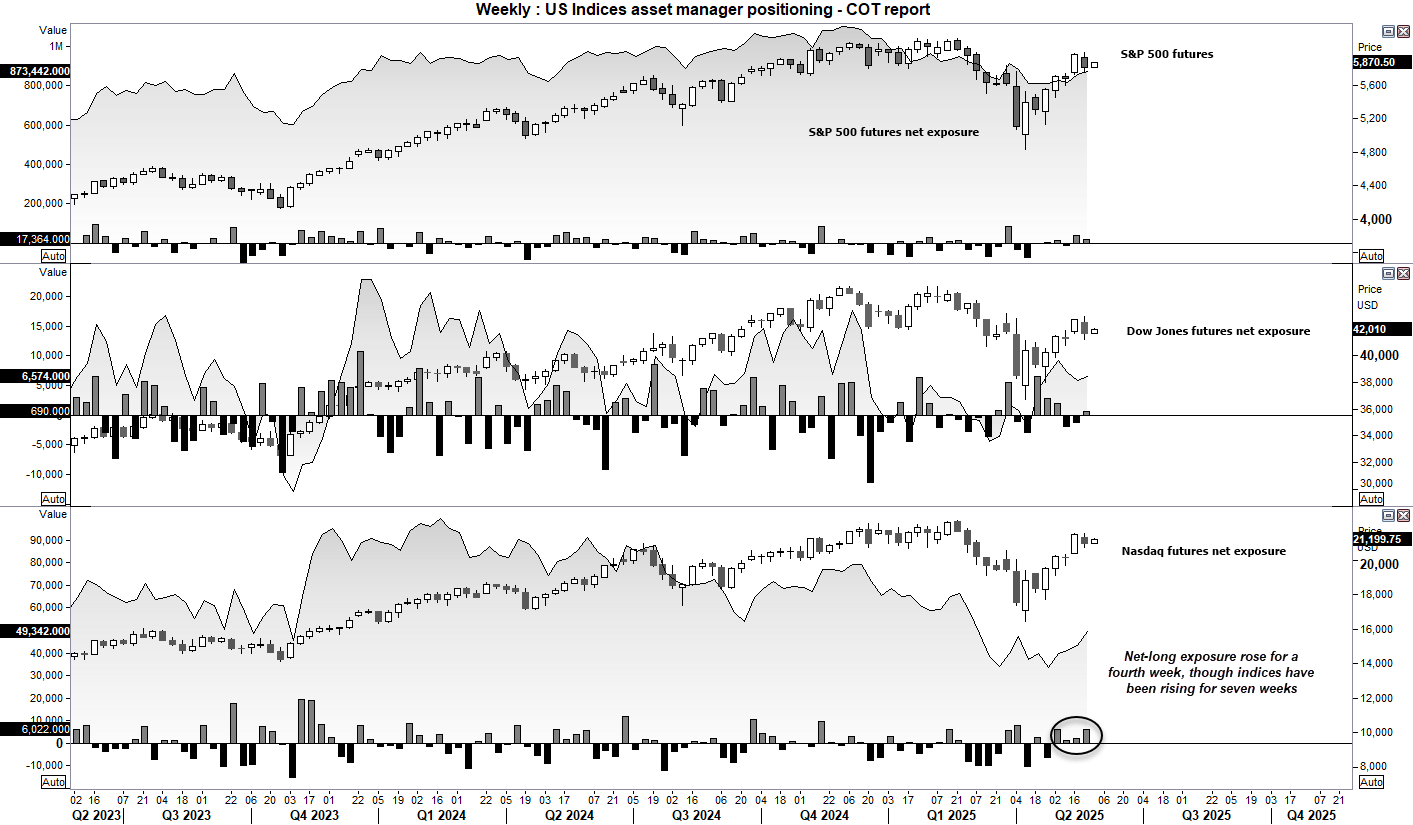
Wall Street Indices Positioning (S&P 500, Dow Jones, Nasdaq 100): Weekly COT Report
Asset managers increased their net-long exposure to Nasdaq 100 futures for a fourth week. Or by 6k contracts last week, or a combined increase of 15.5k contracts over the past four. What is more interesting is that the Nasdaq (and Wall Street indices for the matter) have been rising for several weeks. So to see asset managers – real money accounts – get behind the move, could be seen as bullish.
But as we keep getting reminded, it is Trump’s policies that will ultimately decide whether Wall Street futures will go on to print new highs. If the bond market is to be believed, Wall Street are in for a nasty surprise and the current gains are merely part of a bear market bounce.
Latest market news
September 18, 2025 02:48 PM
June 23, 2025 01:22 PM
June 23, 2025 10:39 AM
June 20, 2025 05:23 PM
June 20, 2025 04:46 PM
June 20, 2025 02:18 PM

June 19, 2025 09:09 AM

June 18, 2025 02:55 PM

June 18, 2025 08:19 AM

June 18, 2025 02:21 AM