
Australian Technical Forecast: AUD/USD Weekly Trade Levels
- AUD/USD responds to uptrend resistance post-Fed - pullback now testing pivotal support
- October opening-range taking shape- break lower would threaten deeper correction within the broader uptrend
- Resistance 6651 (key), 6723, 6795-6811 - Support 6550/65 (key), 6469, 6404
The Australian Dollar is testing a pivotal support zone after reversing off uptrend resistance last month. The October opening range is taking shape just above this level, and the reaction here will be critical for near-term direction. A sustained break below support would mark a deeper correction within the broader uptrend, while stability here could fuel another run at the highs. Battle lines drawn on the AUD/USD weekly technical chart.
Australian Dollar Price Chart – AUD/USD Weekly
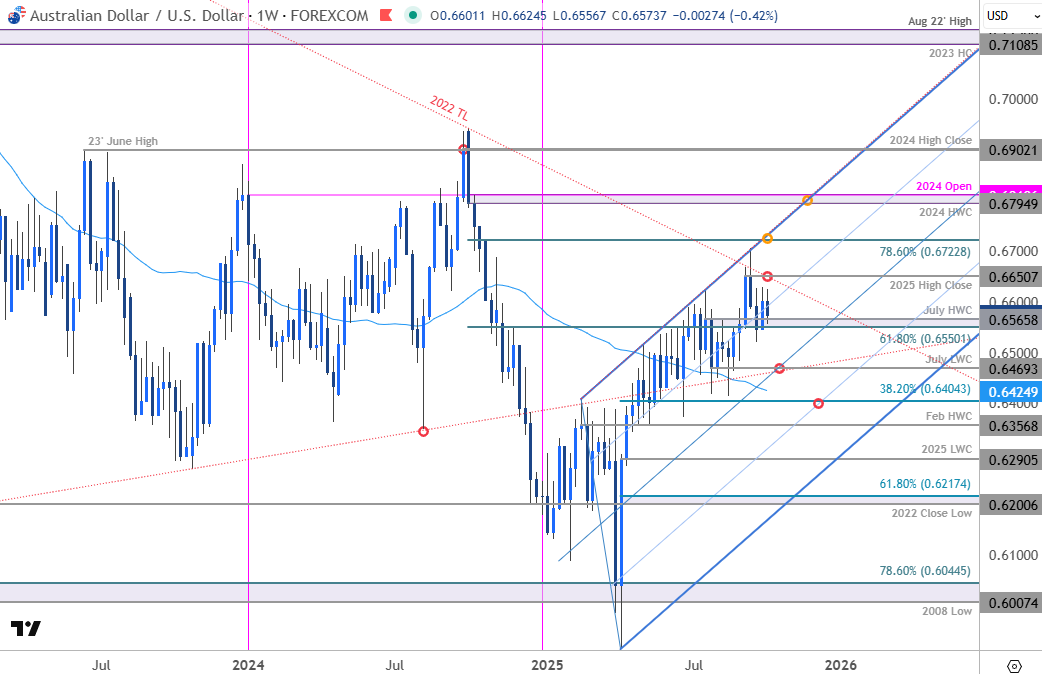
Chart Prepared by Michael Boutros, Sr. Technical Strategist; AUD/USD on TradingView
Technical Outlook: In last month’s Australian Dollar Forecast we noted that AUD/USD was approaching uptrend resistance ahead of the Fed and, “from a trading standpoint, look to reduce portions of long-exposure / raise protective stops on a stretch towards the upper parallel – losses should be limited to 6550 IF price is heading higher on this stretch with a close above 6722 needed to fuel the next major leg of the advance.” Aussie registered an intraweek high at 6707 the following day before exhausting with the subsequent decline extending nearly 2.8% off the yearly high.
AUD/USD is trading just above support for a third-consecutive week at 6550/65- a region defined by the 61.8% retracement of the 2024 decline and the July high-week close (HWC). The focus is on possible inflection off this zone in the days ahead with the October opening-range now taking shape just above. A break / weekly close below this threshold would threaten a larger correction within the March uptrend with subsequent support seen at the July low-week close (LWC) at 6469 and the 52-week moving average, currently near ~6425 (both levels of interest for possible exhaustion / price inflection IF reached). Broader bullish invalidation now raised to the 38.2% retracement of the yearly range at 6404.
Weekly resistance is now eyed at the yearly high-close at 6651- note that the 2022 trendline converges on this threshold over the next two-weeks and further highlights the technical significance of this zone. A breach / close above this slope would be needed to mark resumption of the broader uptrend with subsequent resistance objectives eyed at the 78.6% retracement at 6722 and the 2024 HWC / yearly open at 6795-6810- look for a larger reaction there IF reached.