



British Pound Technical Forecast: GBP/USD Weekly Trade Levels
- GBP/USD halted a four-day losing streak with Sterling testing pivotal downtrend support into the weekly close
- While the broader outlook remains tilted to the downside, the immediate focus is on a possible price inflection off this zone as traders assess post-NFP reaction
- Resistance 1.3140/42, ~1.3220 (key), 1.3280/84- Support 1.3080 (key), 1.2895, 1.2745/73
The British Pound is poised snap a two-week rally with the break below the 52-week moving average taking GBP/USD into downtrend support. A mixed read on the September Non-Farm Payroll report today halted a four-day decline and while the broader downtrend remains intact, the near-term focus is on whether this support zone can spark a short-term recovery or give way to a deeper decline. The jobs data offered little directional clarity for the Dollar, and traders are now watching for confirmation from price action at this level to guide positioning into next week. Battle lines drawn on the GBP/USD weekly technical chart.
British Pound Price Chart – GBP/USD Weekly
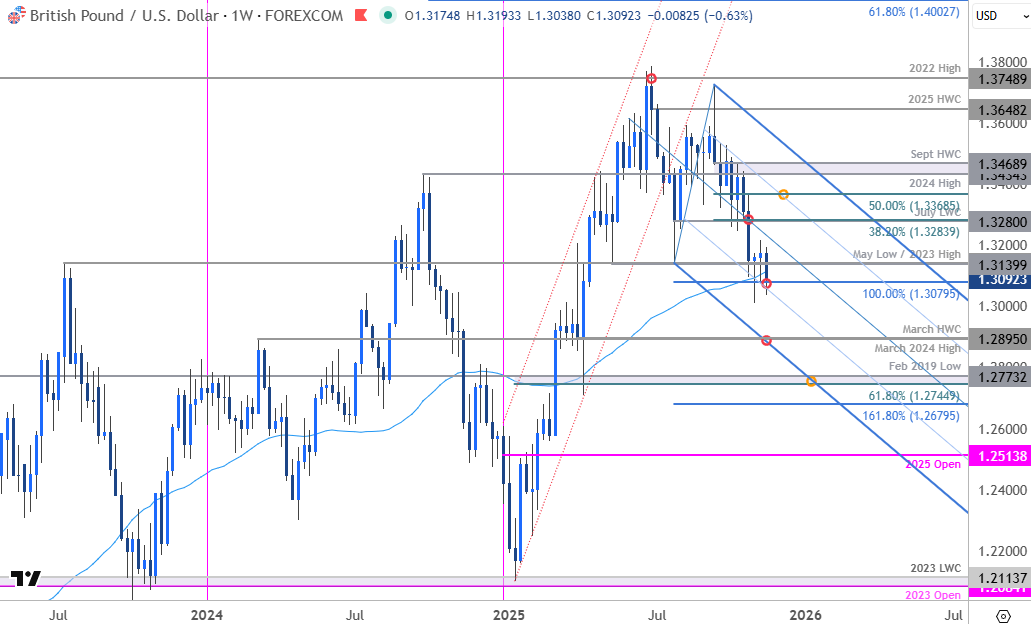
Chart Prepared by Michael Boutros, Sr. Technical Strategist; GBP/USD on TradingView
Technical Outlook: In last month’s British Pound Weekly Forecast we noted that GBP/USD had broken below the October opening-range lows and, “while the decline does threaten a deeper pullback, the immediate focus is on a reaction off this support pivot into the monthly cross. From a trading standpoint, a good zone to reduce portions of short-exposure / lower protective stops- rallies should be limited to the median-line IF price is heading lower on this stretch with a close below 1.3080 needed to fuel the next major leg of this decline.” Sterling failed to mark a weekly close below support into the November open with price rallying nearly 1.6% off the monthly low before exhausting last week just below the median-line. The subsequent decline is now testing support at the 100% extension of the decline off the yearly highs at 1.3080- looking for a reaction off this mark in the days ahead.
Initial resistance is eyed at the May / July lows and the 2023 swing high at 1.3140/42 and is backed by the median-line, currently near ~1.3220s. A break / weekly close above this slope is needed to suggest a more significant low is in place and that a large recovery is underway within the broader downtrend. Subsequent resistance is eyed at the July low-week close (LWC) and the 38.2% retracement of the September decline at 1.3280/84 with broader bearish invalidation now lowered to the 50% retracement at 1.3369.
A break / weekly close below 1.3080 and the 25% parallel is needed to mark resumption of the June downtrend with subsequent support objectives seen at the March 2024 high and the 2025 March high-week close at 1.2894/95. Note that the lower parallel converges on this threshold next week- look for a larger inflection there IF reached. The next major technical consideration rests at 1.2745/73- a region defined by the 61.8% retracement of the yearly range and the February 2019 low.

Bottom line: Sterling is testing support this week and although the broader outlook remains tilted to the downside the immediate focus is on possible inflection off this zone with short-bias vulnerable while above. From a trading standpoint, rallies should be limited to 1.3140 IF price is heading lower on this stretch with a close below the 25% parallel needed to fuel the next major leg of this decline. Review my latest British Pound Short-term Outlook for a closer look at the near-term GBP/USD technical trade levels.
GBP/USD Economic Data Releases
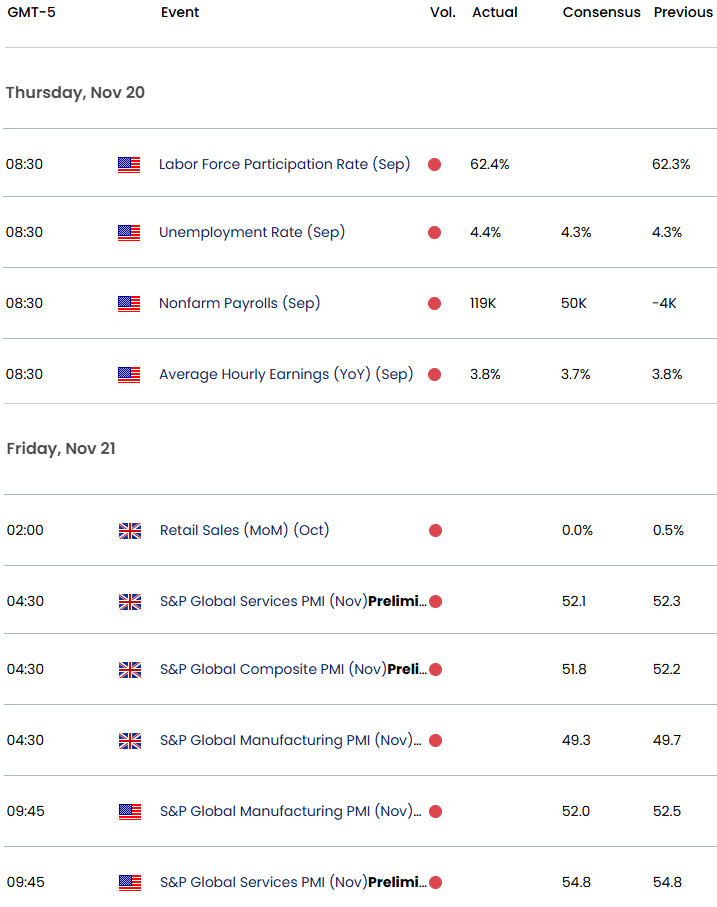
Economic Calendar - latest economic developments and upcoming event risk.
--- Written by Michael Boutros, Senior Technical Strategist
Follow Michael on X @MBForex






