



British Pound Technical Outlook: GBP/USD Short-Term Trade Levels
- GBP/USD March opening-range preserved with the bears testing a pivotal support zone for a seventh consecutive session
- Sellers continue to press this multi-month pivot, with repeated intraday breaks but no confirmed daily close below the level- for now.
- A sustained break beneath support would validate downtrend resumption, while stabilization above it keeps the range intact heading into month-end.
- Major event risk on tap with US PCE tomorrow and Fed / BoE next week
- Resistance ~1.3442, 1.3474/89 (key), 1.3536- Support 1.3339/51 (key), 1.3194, 1.3140
GBP/USD remains pinned just above a key structural support zone following an extended decline from late-January highs. Despite multiple attempts by sellers to force a confirmed break, price has yet to secure a decisive daily close below this floor. The prolonged standoff has compressed volatility and heightened the probability of an eventual directional move. Whether support finally yields or holds firm will likely determine the next meaningful phase for Sterling as the month draws to a close. Battle lines drawn on the GBP/USD short-term technical charts.
British Pound Price Chart – GBP/USD Daily
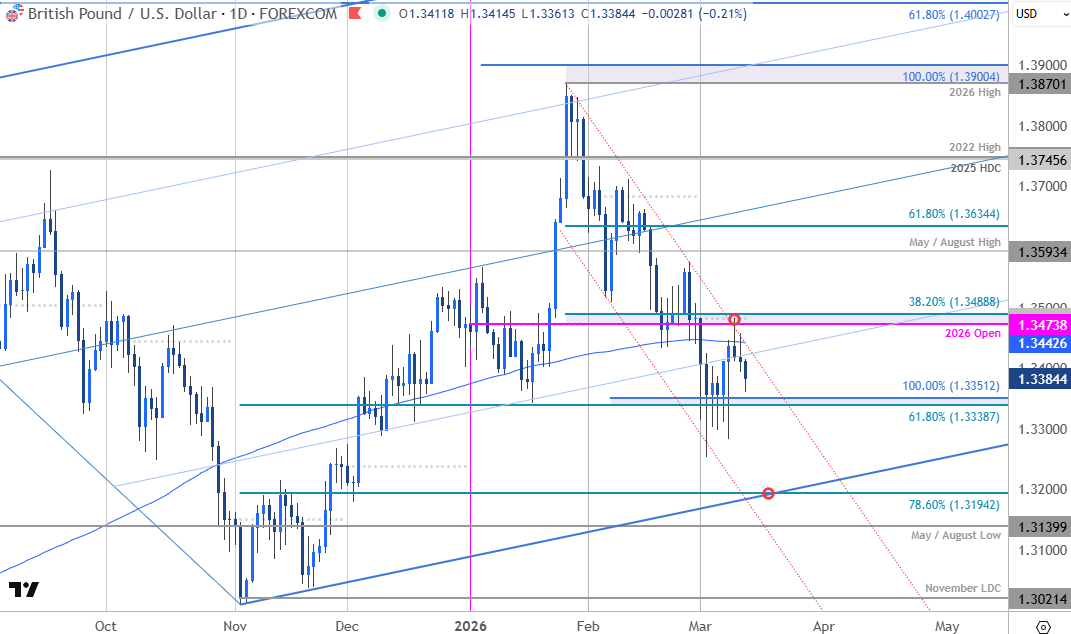
Chart Prepared by Michael Boutros, Sr. Technical Strategist; GBP/USD on TradingView
Technical Outlook: In last month’s British Pound Short-term Outlook, we noted that GBP/USD had broken the February opening-range lows and the focus was on a reaction into the 200-day moving average. Our bottom line highlighted that, “From a trading standpoint, rallies should be limited to 1.3593 IF price is heading lower on this stretch with a close below the 1.3443 needed to fuel the next leg of this decline.” Sterling rebounded in the following days with price registering an intraday high at 1.3575 before reversing sharply lower.
A break below the 200DMA into the start of March exhausted into confluent Fibonacci support at the 61.8% extension of the November advance and the 100% extension of the January decline at 1.3339/51. The bears have been unable to mark a daily close below this pivot zone despite six-separate attempts, and although the medium-term outlook remains weighted to the downside, a close below this zone is still needed to fuel the next major leg of the late-January downtrend.
British Pound Price Chart – GBP/USD 240min
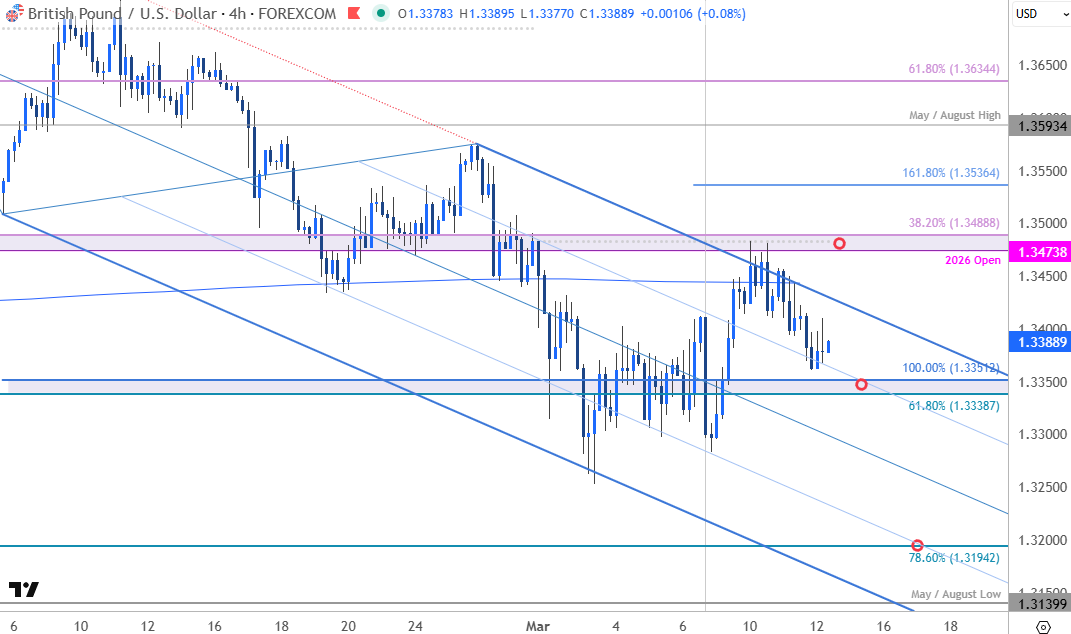
Chart Prepared by Michael Boutros, Sr. Technical Strategist; GBP/USD on TradingView
Notes: A closer look at Sterling price action shows GBP/USD continuing to trade within the confines of a descending pitchfork extending off the January high. A break / close below 1.3339 would be needed to threaten downtrend resumption towards the 78.6% retracement of the November rally at 1.3194 and the May & August swing lows at 1.3140. Both levels of interest for possible downside exhaustion / price inflection IF reached.
Initial resistance is eyed back at the 200-day moving average (currently ~1.3442) with near-term bearish invalidation now lowered to 1.3474/89- a region defined by the yearly open, the March open, the weekly range high, and the 38.2% retracement of the January decline. A breach / daily close above this threshold would be needed to suggest a more significant low is in place and a larger trend reversal is underway. Subsequent resistance eyed at he 1.618% extension of the most recent advance at 1.3536 and the May / August high at 1.3593.

Bottom line: Sterling is approaching pivotal support at the 2026 close low, and the focus is on a reaction off this mark. Note that the March opening-range is preserved and a breakout should offer clear guidance here. From a trading standpoint, rallies should be limited to 1.3442 IF price is heading lower on this stretch with a close below 1.3339 needed to fuel the next major leg of the decline.
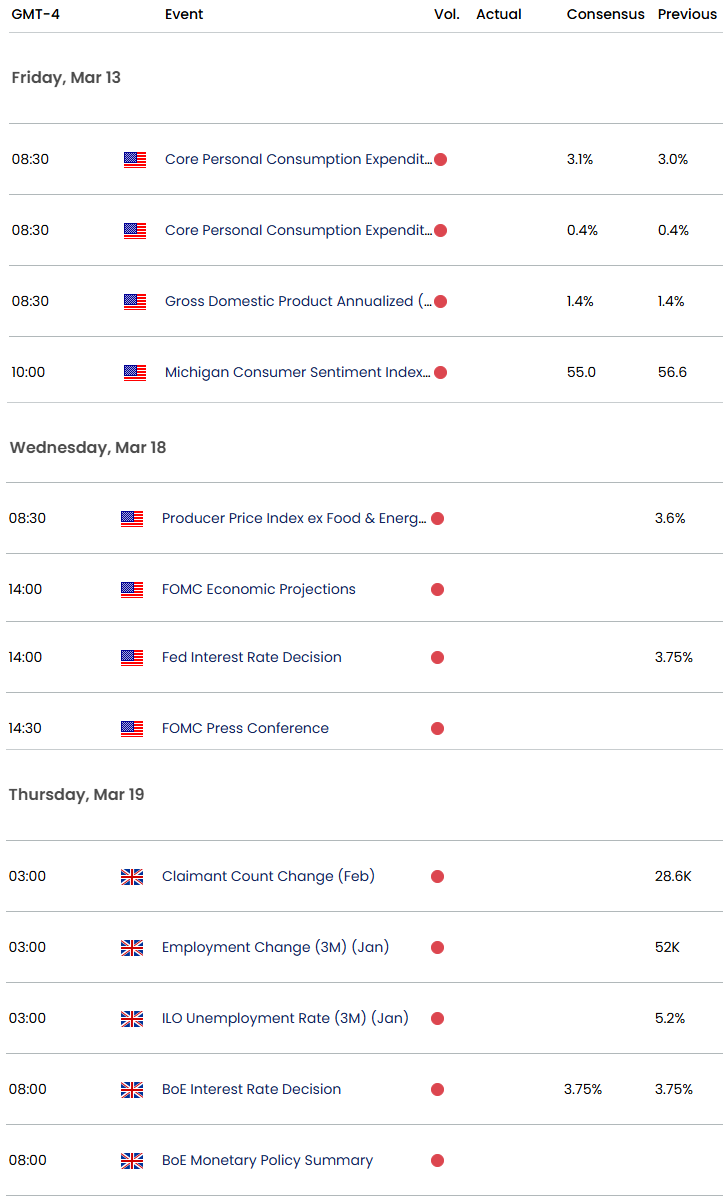
Keep in mind we get the release of the January Personal Consumption Expenditures tomorrow with the Federal Reserve and Bank of England interest rate decisions on tap next week. Traders will be closely eyeing the Federal Reserve’s updated Summary of Economic Projections amid growing uncertainty regarding the outlook for monetary policy. The recent surge in oil prices caused by the ongoing war in Iran has clouded the inflation outlook, and with last week’s dismal Non-Farm Payrolls report showing signs of weakness in the labor markets, the Fed’s dual mandate is once again at odds. As of now, markets are still pricing just a 43% probability for a rate cut in July with September now showing a 64% chance. Look for the updated interest rate dot-plot to shed some light on the potential timing of the next move from the Fed next week. Keep your eyes on the headlines and watch the weekly closes here for guidance. Review my latest British Pound Weekly Forecast for a closer look at the longer-term GBP/USD technical trade levels.
Key GBP/USD Economic Data Releases
--- Written by Michael Boutros, Senior Technical Strategist
Follow Michael on X @MBForex





