



Bitcoin Technical Forecast: BTC/USD Weekly & Daily Trade Levels
- Bitcoin breakout of November downtrend surges more than 8.6% into the January open
- BTC/USD five-day rally halted at confluent resistance- December range remain intact
- Despite the near-term breakout attempt, the broader structure keeps bulls vulnerable while below range resistance, with downside risk still prominent near-term.
Bitcoin has surged into the January open with five-day rally extending than 13% off the December low. The breakout of the November downtrend has yet to escape the confines of the December opening-range and the broader structure keeps bulls vulnerable as long as price remains capped below range resistance. The focus now turns to whether this surge can transition into a sustained breakout or if the rally ultimately proves to be a bull trap, opening the door for renewed downside pressure. Battle lines drawn on the BTC/USD technical charts.
Bitcoin Price Chart – BTC/USD Weekly
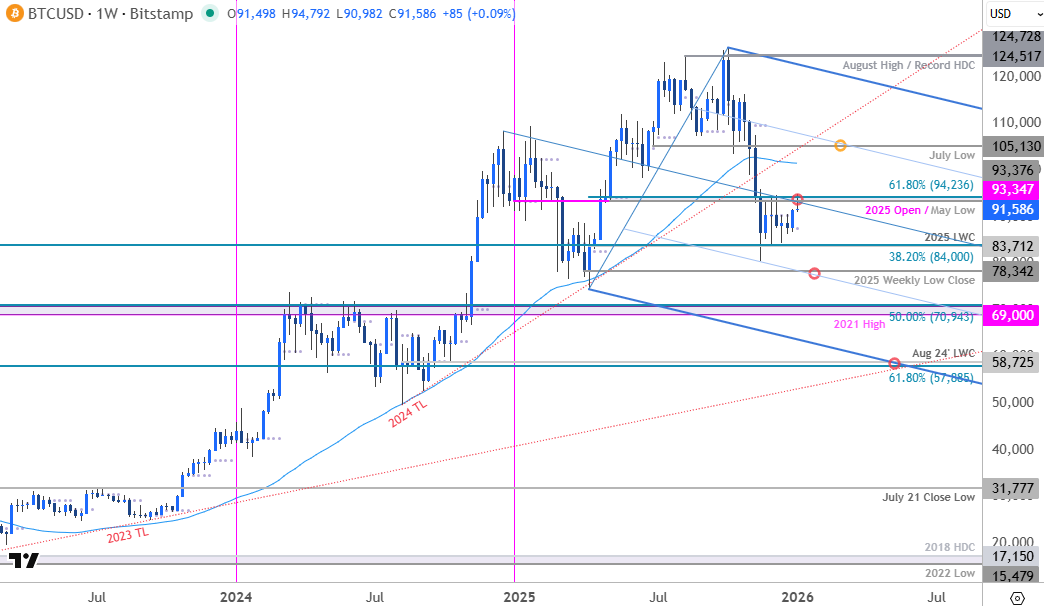
Chart Prepared by Michael Boutros, Sr. Technical Strategist; BTC/USD on TradingView
In last month’s Cryptocurrency Forecast we note that, “Bitcoin is trading just below technical resistance with the December opening-range intact heading into next week- look for the breakout to offer guidance here. From a trading standpoint, rallies should be limited to the 94,236 IF price is heading lower on this stretch..” BTC/USD rallied more than 17% off the November lows and although price briefly registered an intraday high at 94,792, Bitcoin was unable to mark a daily close above resistance at 93,347-94,236- a region defined by the objective 2025 yearly open, the May low, and the 61.8% retracement of the 2025 yearly range. The focus into the start of the month is on possible price inflection off this mark with the technical outlook still tilted to the downside while below.

Bitcoin Price Chart – BTC/USD Daily
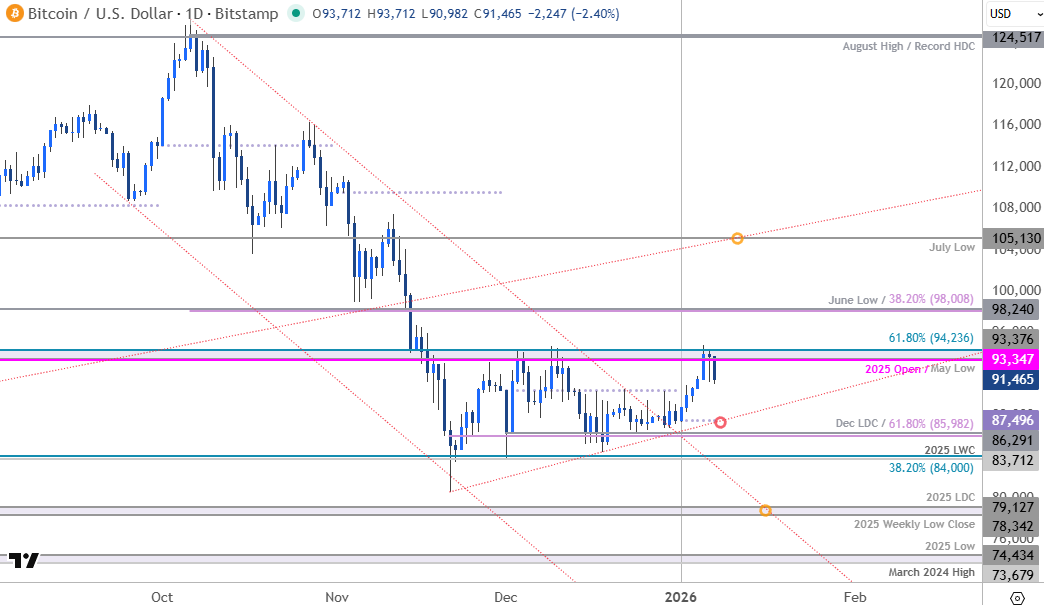
Chart Prepared by Michael Boutros, Sr. Technical Strategist; BTC/USD on TradingView
A closer look at the Bitcoin daily chart shows BTC/USD breaking above the October downtrend into the close of December with the rally failing to mount resistance for a third consecutive day. Yearly-open support now rests at 87,496 and is backed closely by the 61.8% retracement of the November rally and the December low-day close (LDC) at 85,982-86,291. Key support remains unchanged at 83,712-84,00 – a region defined by the 2025 low-week close (LWC) and the 38.2% retracement of the 2022 advance. Losses below this threshold would threaten resumption of the multi-month downtrend with the next major technical consideration eyed at the 2025 weekly low-close and the 2025 low-day close at 78,342-79,127.
A topside breach / weekly daily close above this key pivot zone would be needed to suggest a more significant low is in place and a larger trend reversal is underway. Such a scenario would shift the focus back towards subsequent resistance objectives at the 38.2% retracement of the October decline and the June swing low at 98,008/240 and the June low 105,130.
Bottom line: Despite a near-term breakout into the close of the year, Bitcoin remains within the objective December opening-range and the focus remains on a breakout in the weeks ahead for guidance. From a trading standpoint, the bulls remain vulnerable while below 94,263 with a break below 83,712 needed to fuel the next major leg of the Bitcoin decline.
--- Written by Michael Boutros, Senior Technical Strategist
Follow Michael on X @MBForex






