
- Fed and dollar narratives struggle to explain Bitcoin's latest rout
- Gold, Bitcoin and AI winners sold off at the same time
- SpaceX reportedly attracted $250 billion chasing $75 billion of stock
- Excess liquidity raised for allocations may not stay sidelined
Momentum Winners Get Smoked
Bitcoin's latest rout has many traders scratching their heads, with all kinds of explanations being bandied around, including a stronger dollar and hawkish repricing in Fed expectations. The problem is the evidence doesn't really support either conclusion. Over the past five sessions, BTC/USD has exhibited little relationship with both, suggesting the usual macro suspects may not have been the primary drivers.
Instead, it's the strong positive correlation with gold that's interesting. Risk appetite may have contributed at the margin given the relationships with S&P 500 and VIX futures, but it's unusual that two former momentum favourites got smoked simultaneously. The fact that several AI winners have also come under pressure only adds to the intrigue.
The Allocation Catch
One possible explanation is that investors have been raising liquidity ahead of SpaceX's upcoming IPO, the largest in history. The company is looking to raise $75 billion at a valuation of around $1.75 trillion, with demand reportedly approaching $250 billion, nearly four times the stock on offer. Money has to come from somewhere.
Bitcoin, gold and many AI names may be well off their highs, but plenty of holders would still be sitting on substantial gains. If you need liquidity quickly, you don't necessarily sell what you dislike. More often, you sell what you can.
A deal that's four times oversubscribed means many investors will receive only around a quarter of the stock they applied for. If liquidity was raised by selling Bitcoin, some of that capital could quickly find its way back once the dust settles.
Bear Flag or Bottom?
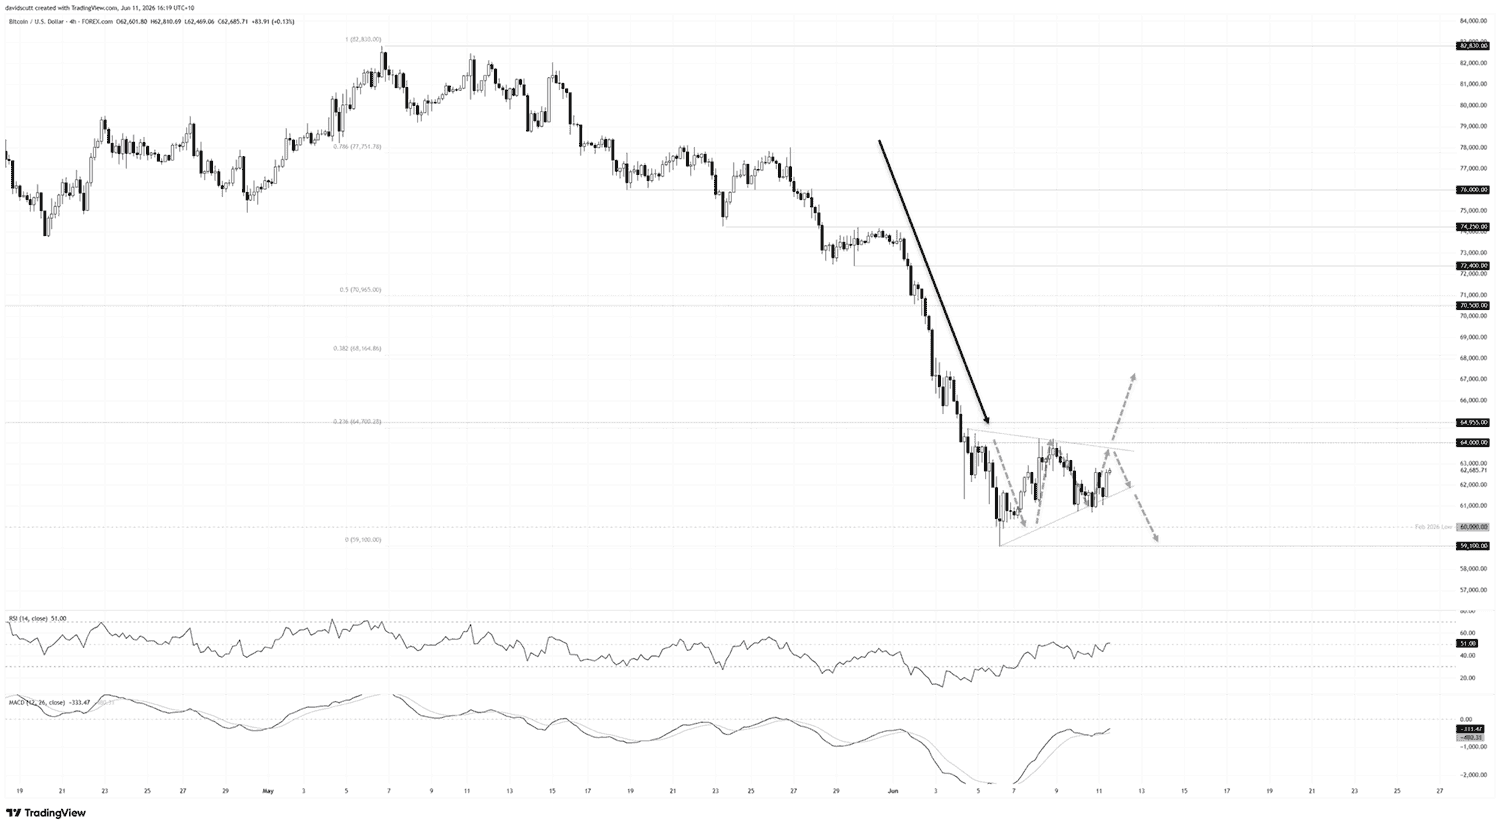
Source: TradingView
What's notable since the lurch lower in early June is that the price has stabilised following a brief foray beneath the key psychological $60,000 level hit earlier this year. In the days since, we've seen the price coiling within a structure resembling either an ascending triangle or bear flag.
Being a four-hour chart and having only been tested on a handful of occasions, it's still far too early to tell which, if either, is emerging. But it's certainly grabbed my attention. Is this just a temporary pause before the next waterfall lower, as the bear move into the structure would suggest? Or have we seen another bottom put in around $60,000? I don't know, but I'm watching the price action for clues.
On the topside, keep an eye on $64,000 where the price stalled repeatedly over the past week. If we were to see a close above that level, followed by a bullish extension through $64,955, a swing low set in late March, it may encourage additional bulls off the sidelines. That could pave the way for a push towards the 38.2% Fibonacci retracement of the March-June decline at $68165 or former support at $70,500, with the 50% retracement sitting just above the latter.
However, should we see a downside break of the structure, preferably accompanied by a close beneath $61,000 where bids emerged earlier this week, the move, pattern and price action into it may see bears go for the jugular. That could trigger another probe beneath $60,000 to test the recent lows. If that breaks, there's not a lot of support to hang your hat on until the mid-to-low $50,000s, with $55,600 and $52,650 two levels of note.
Right now, the oscillators on the four-hour timeframe are broadly neutral, placing greater emphasis on the price action when evaluating directional risks.