



During today’s session, and despite the release of the Federal Reserve minutes, gold managed to hold above the $4,500 per ounce area and posted a gain of more than 1.3%. However, this recovery is still not strong enough to erase the selling bias that has been in place since previous sessions, when price started to pull back from the $4,700 area.
This behavior suggests that a phase of indecision has started to gain relevance in the short term. For now, if the bond market continues to act as a relevant substitute asset and maintains consistent appeal, it could be difficult for stronger buying pressure to stabilize in gold. In this context, XAU/USD could continue to show mixed movements over the coming weeks.

Bond market remains relevant despite the minutes
During today’s session, the Federal Reserve minutes corresponding to the late-April 2025 meeting were released. In that decision, the central bank kept interest rates unchanged at the 3.75% reference level, although it highlighted relevant comments regarding elevated inflation in the United States, driven by the strong rebound in energy prices seen in previous weeks, an event associated with the conflict in the Middle East.
Most board members acknowledged a greater risk that inflation could take longer to return to the 2.00% target. However, the tone remained cautious and did not clearly point to potential rate hikes in the nearest monetary policy decisions.
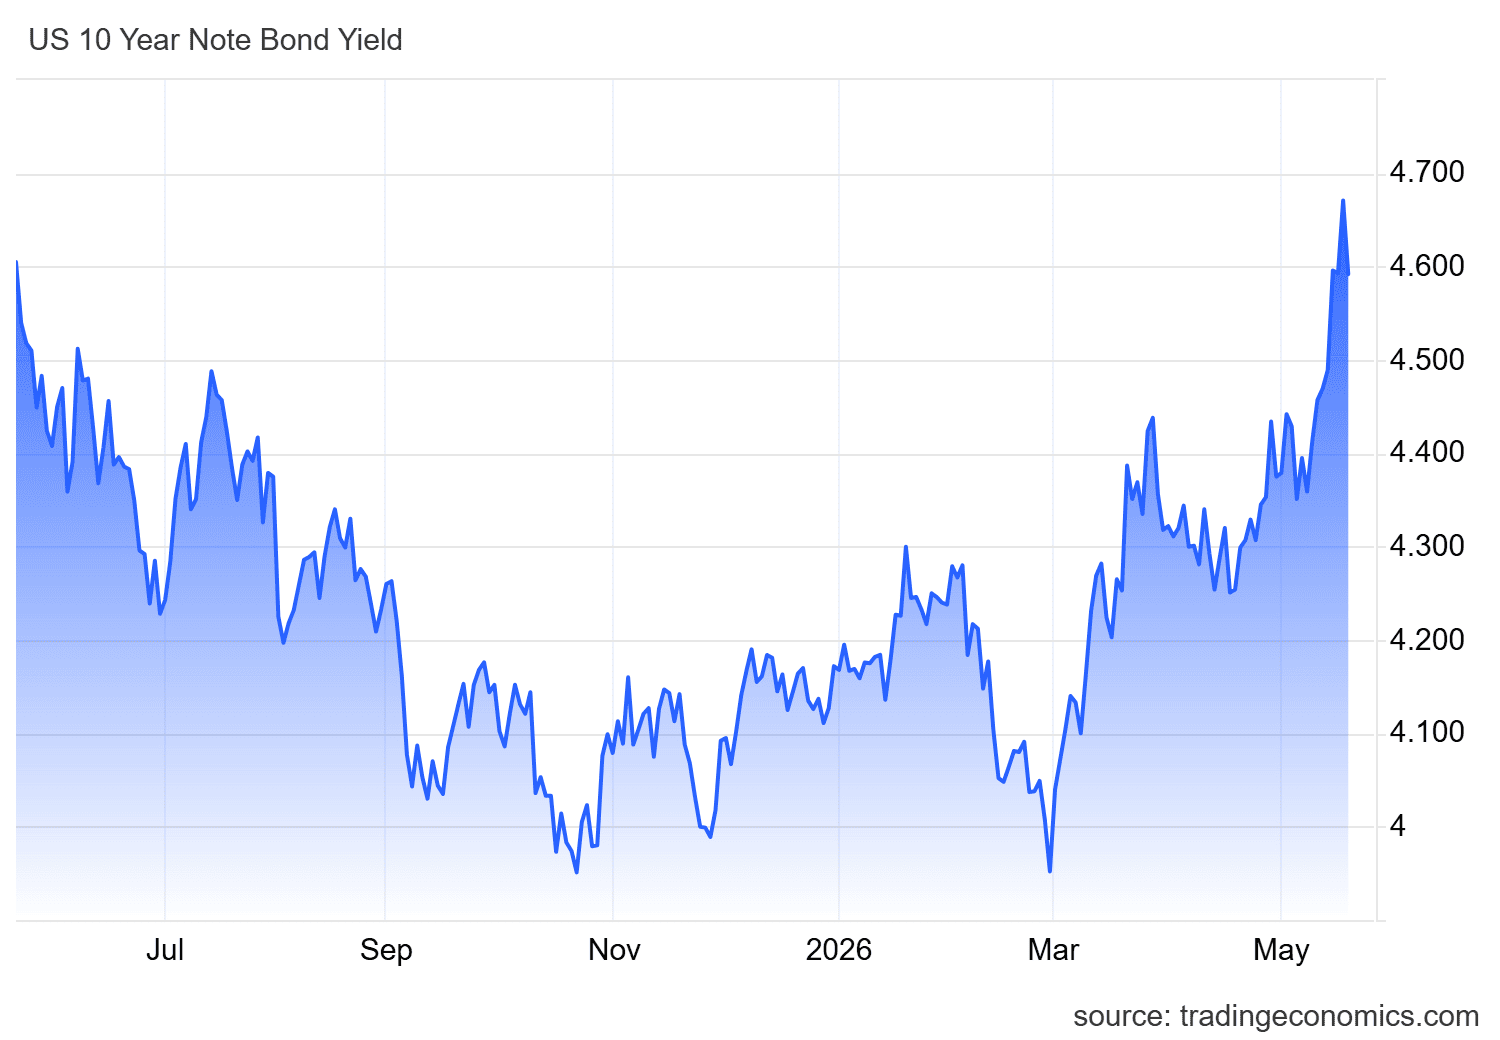
For this reason, although the minutes showed a somewhat restrictive tone, they were not as aggressive as the market seemed to anticipate. This helped soften part of the short-term restrictive expectations and slowed the strong advance that 10-year bond yields had been showing in recent sessions.
After the release of the minutes, the 10-year Treasury yield started to fall below the 4.6% area, moving away from the yearly highs seen recently. Although this move does not eliminate the underlying bullish bias in yields, it does reflect some calm after the sustained advance seen in recent weeks.
Source: TradingEconomics
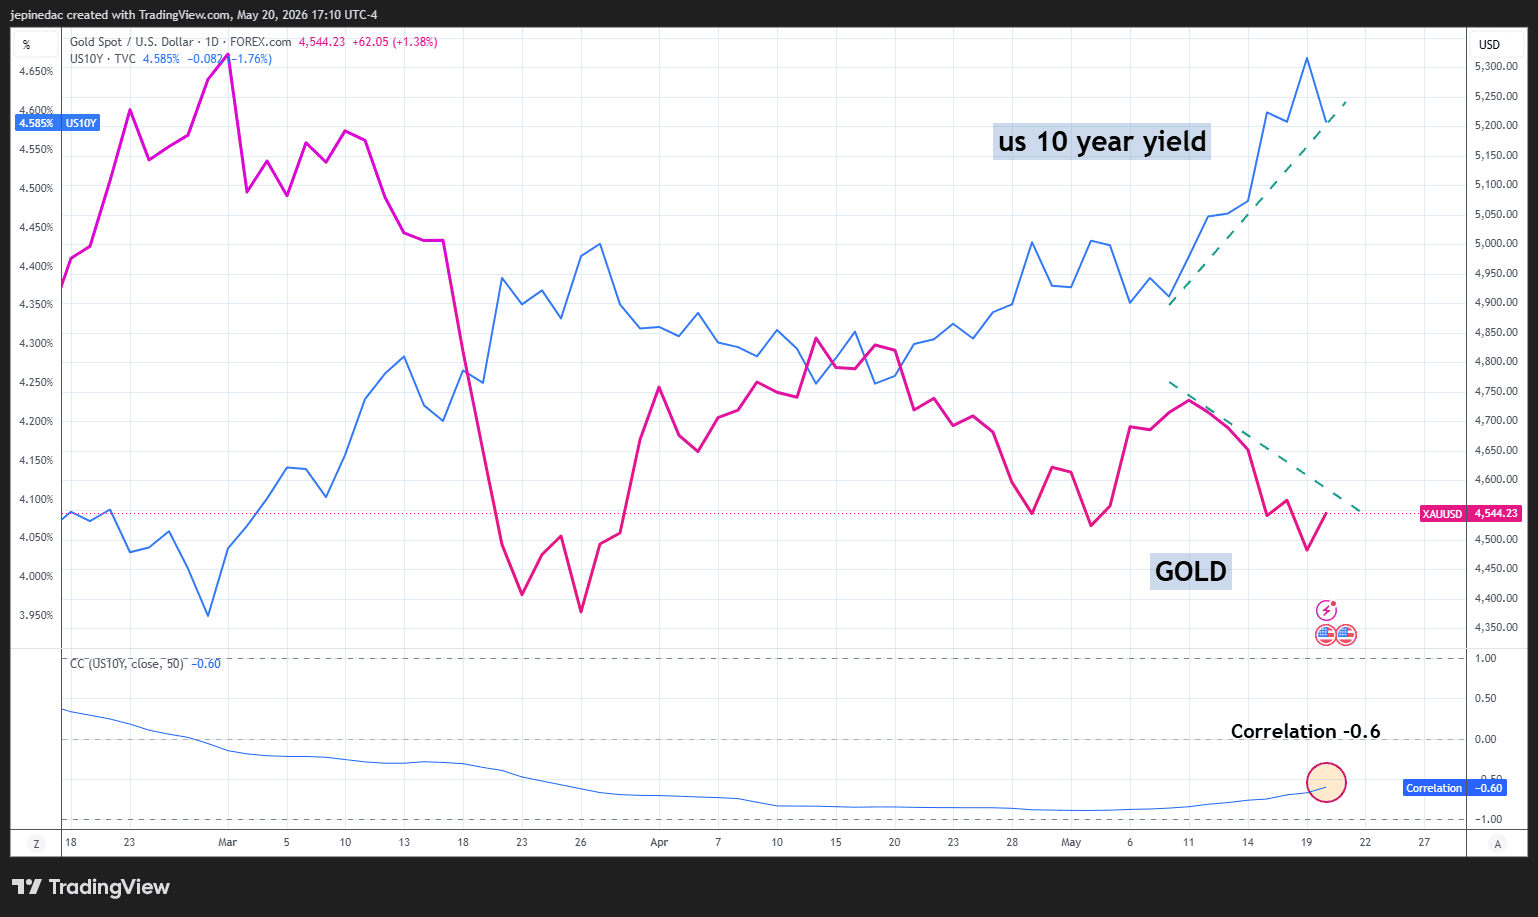
This move has acted as temporary support for gold’s recovery during the session. Over the past few weeks, the metal has maintained a moderate inverse relationship with the US 10-year Treasury yield, with a correlation coefficient near -0.6 over the last 50 sessions. The correlation coefficient can change over time.
This implies that when bond yields rebound, gold tends to face greater difficulty gaining ground, mainly because the US bond market remains one of its main substitute assets.
Source: StoneX, TVC, Tradingview
In this context, the pause in the rise of yields after the publication of the minutes, possibly because much of the move had already been priced in by the market, has allowed gold to recover some buying strength during the session. However, this does not eliminate the underlying relationship or the threat that bonds continue to represent as a substitute asset.
If yields resume the upward momentum seen in recent weeks, bonds could maintain relative appeal over gold and make it harder for the metal to gain ground consistently. If the bond market does not show relevant declines in yields, a phase of indecision could remain present in XAU/USD price action over the coming sessions.
Technical outlook for gold
Source: StoneX, Tradingview
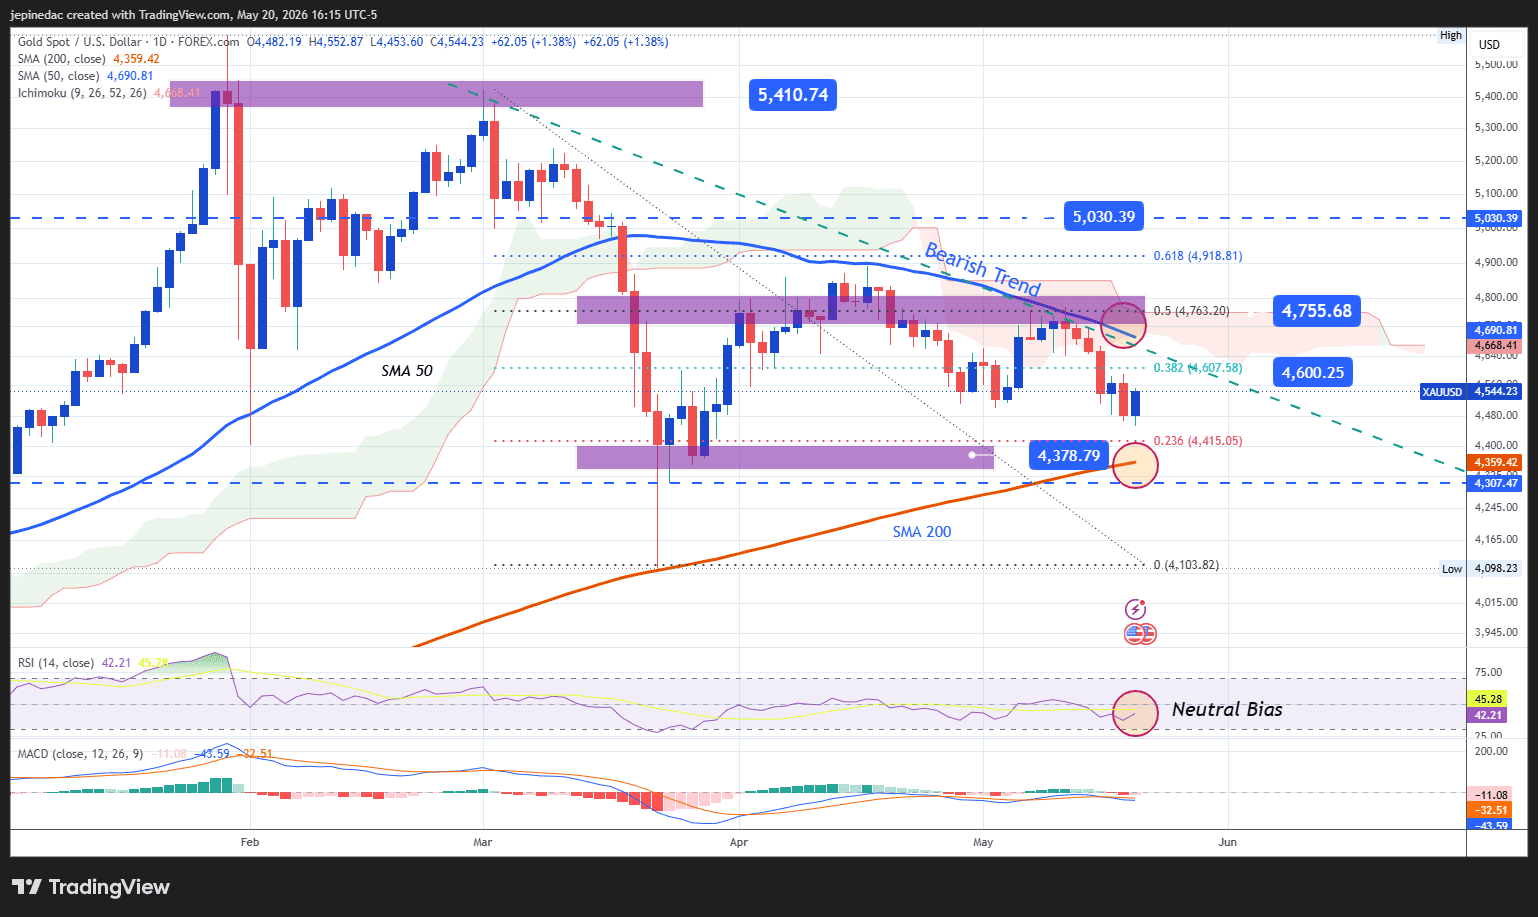
- The bearish trend remains relevant: Since the first days of March, a bearish trendline has been forming and, in the absence of relevant bullish moves, it remains the dominant technical structure on the chart. Despite some recovery attempts, price has not managed to break this formation, so if selling pressure stabilizes again, this trend is likely to remain the main pattern to watch over the coming weeks.
- RSI: Now, RSI movements have started to approach the neutral 50 area again. This level is relevant because it reflects a balance in market momentum, which could be highlighting a possible phase of indecision in gold’s movements over the coming sessions.
- MACD: The MACD shows a similar dynamic, as the histogram remains close to the 0 area. This indicates a balance in the average strength of short-term moving averages and could also be signaling a potential phase of neutrality in gold’s short-term price action.
Key levels to watch:
- 4,755 USD – Crucial resistance: A recent high level that coincides with the 50-period moving average and the 50% Fibonacci retracement level. Moves above this area could put the current bearish trend at risk and open the door to a more consistent buying bias.
- 4,600 USD – Near-term barrier: A neutral zone that has acted as a retracement point in recent weeks and coincides with the 38.2% Fibonacci level. Moves around this level could reinforce a sideways phase and even consolidate a short-term range.
- 4,378 USD – Critical support: A relevant low level that coincides with the area marked by the 200-period simple moving average. Price action that manages to break below this level could confirm a dominant selling bias and extend the bearish trendline over the coming sessions.
Written by Julian Pineda, CFA, CMT – Market Analyst
Follow him on: @julianpineda25





