



- Gold slips beneath 200DMA for first time since 2023
- Gold, silver and crypto getting smoked together in Asia
- Correlations bordering on one hint at unhealthy market conditions
- Near-parabolic momentum trades leave little margin for error
When Former Momo Darlings Start Cracking
Both gold and silver are getting hosed in Asia, coinciding with fresh fighting between US and Iranian forces in the Gulf. What I find interesting is that crypto is getting smoked too, even though US yields are well off levels seen earlier this week while equities continue to levitate within spitting distance of record highs.
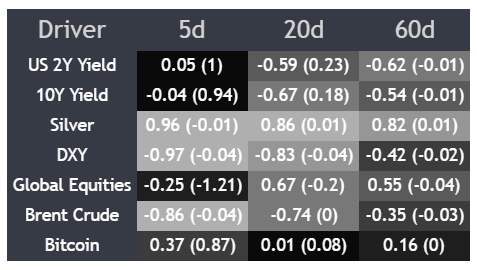
Clearly, FX, along with energy, is a factor looking at the correlation matrix for gold below, so it could just be a dollar squeeze into month-end that flips when the calendar turns. But the fact these former momo fan favourites are getting slammed together despite the broader backdrop makes me question whether it may be a sign of things to come in other momo markets that have been running hot, like chips and semis, or, on the contrary, fuel to feed the AI beast even more as capital is rotated.
Source: TradingView
Echoes of Speculative Excess
Whatever the answer, correlations bordering on one are hardly a sign of a healthy market and feel more indicative of liquidation than anything else. That’s what makes me a little cautious looking at some of the near-parabolic moves seen recently in other high-beta growth and technology-related themes because, when you combine stretched positioning with plenty of leverage, it doesn’t take much for losses on long positions to spark something nasty elsewhere.
The earnings growth story may justify the moves we’re seeing in theory, but a lot of that still reflects the enormity of the infrastructure buildout. It also doesn’t prevent liquidations.
Regardless of where they’re launched, the arrival of single-stock leveraged ETFs into markets that already resemble a bull market competing at the Enhanced Games just reeks of a top. So too do reports that South Korea’s mandatory leverage education platform for investors has reportedly been crashing after being overwhelmed by demand ahead of launch.
Add in reports that rebalancing flows linked to leveraged products were accounting for a sizeable share of turnover during recent selloffs and it’s hard not to look at parts of the broader chips and semis space and think speculative behaviour may be getting a little stretched.
Chasing Momentum Wherever It’s Found
That’s why I’m paying close attention to what happens next in gold and silver because, whether justified or not, these markets may be acting as an early warning sign for broader risk appetite in some of the market’s hottest trades.
I remember writing about the potential for mean reversion in silver back in late January just before it suffered its largest one-day decline on record in both dollar and percentage terms, and parts of the market have a bit of that same feeling right now. It probably even involves many of the same participants who chase momentum regardless of where it’s found.
Gold Cracks the 200DMA
Source: TradingView
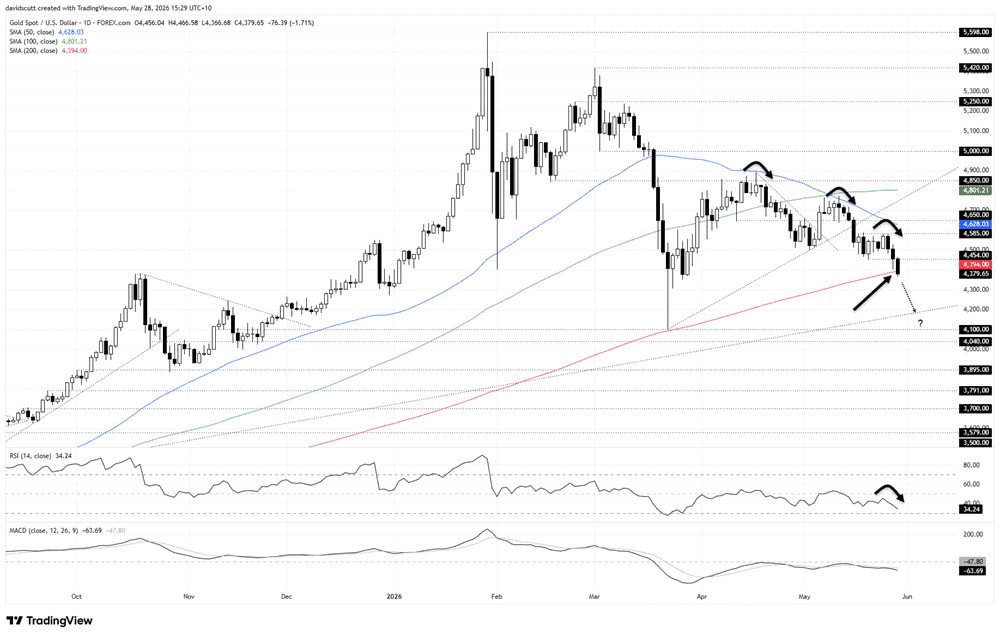
Gold finds itself trading beneath the 200DMA for the first time since October 2023 in Asia, making the price action into the close important after a backtest and rejection of former support at $4454 earlier in the session. It just looks heavy, be it the sequence of lower highs and lower lows or the inability to break above the 50DMA earlier this month.
That medium-term moving average is now keeling over with a negative slope, complementing the nearer-term signal from RSI (14), which continues to trend lower beneath 50 but is not yet oversold. MACD has also flipped lower after crossing over from above, confirming the bearish message that downside momentum is building.
Worryingly for bulls, there’s little for them to hang their hat on in terms of nearby support until the low-$4100s. Therefore, unless we see a definitive reversal back above the 200DMA into the close, the technical picture risks deteriorating further.
Should bulls successfully defend the 200DMA, $4454 is the immediate level overhead to watch, followed by $4585 which capped gains for over a week prior to the latest leg lower.
Silver Holding the Line, For Now

Source: TradingView
Silver is not yet testing its 200DMA, but the technical picture is not totally dissimilar, resting on uptrend support that dates back to August last year. The price deviated way above the trendline during the parabolic phase late last year but held it during the only real test since during the mania unwind in March, with bulls stepping in to force the price back above.
It’s therefore the key level to watch immediately below, with the April 28 swing low at $70.90 the next after that. Should we see a breakdown through those levels, it would add to the case for shorts, putting the 200DMA in play for bears.
Should the uptrend continue to hold, longs could still be considered with a tight stop below for protection, initially targeting $78 resistance with the 100DMA and $83 resistance other options after that.
The momentum picture is less pronounced for silver than gold, with RSI (14) only dribbling lower beneath 50 while MACD has only just flipped negative. It’s hardly indicative yet of an imminent market puke, explaining why I’m still more constructive on two-way risk in silver than gold at this stage.






