



Gold Technical Forecast: XAU/USD Weekly Trade Levels
- XAU/USD snapped a four-week winning streak after failing near major resistance.
- Focus is on a reaction off the record high-week close- a sustained breakout would signal continuation of the multi-week advance.
- A move below near-term support would suggest a deeper correction is underway.
- Event risk ahead: Iran war negotiations / headlines, FOMC rate decision & US Core PCE
- Resistance 4894 (key), 5025, 5279– Support 4492-4540 (key), 4319, 4098-4112
Gold prices have started to pull back after stalling near a key resistance zone, marking a shift in near-term momentum following a strong multi-week advance. The rejection highlights the importance of this barrier, with price now drifting back toward support levels that could determine whether the recent rally was merely corrective or part of a broader bullish continuation. The focus in the sessions ahead will be on how price reacts to this pullback and whether buyers step back in. Battle lines drawn on the XAU/USD weekly technical chart heading into April.
Gold Price Chart – XAU/USD Weekly
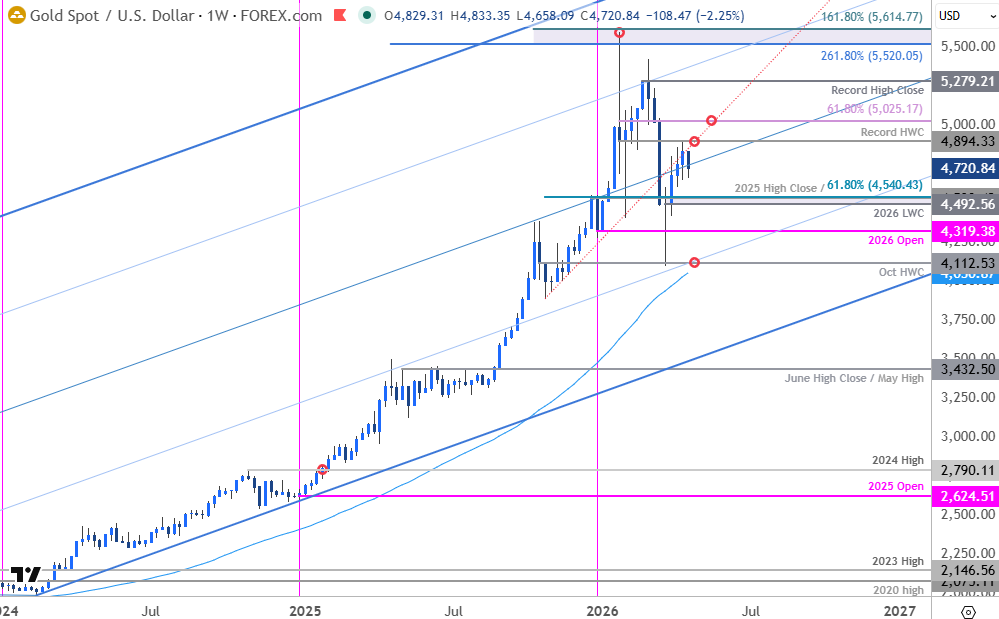
Chart Prepared by Michael Boutros, Sr. Technical Strategist; XAU/USD on TradingView
Technical Outlook: In last month’s Gold Technical Forecast we noted the potential that XAU/USD may have registered a more significant low the previous week and that, “From a trading standpoint, losses would need to be limited to the yearly open IF price is indeed heading higher on this stretch with a close above 4671 needed to fuel the next leg of the recovery.” Gold surged more than 19.3% off the yearly low with a four-week rally turning just ahead of resistance at the record high-week close (HWC) at 4894.
The pullback takes gold just above the objective monthly open at 4669 and a slip back below the median-line could fuel a test of more significant support. Weekly support now rests at 4493-4540- a region defined by the yearly low-week close (LWC), the 2025 high-close, and the 61.8% retracement of the October rally. Losses below this pivot zone would suggest a deeper correction is underway back toward the yearly open at 4319 and the October high-week close (HWC) / yearly low at 4098-4112.
A topside breach / weekly close above 4894 exposes subsequent resistance objectives at the 61.8% retracement of the year-to-date range at 5025 and the record high-close at 5279. Look for a larger reaction there IF reached.

Bottom line: Gold snapped a four-week winning streak with XAU/USD trading just below resistance at the record high-week close. From a trading standpoint, losses should be limited to 4493 IF price is heading higher on this stretch with a close above 4894 needed to fuel the next leg of the advance.
A series of central bank rate decisions is due next week, with the Fed in focus on Wednesday. While no changes are expected, markets will parse the commentary for signals on how policymakers area assessing inflation—particularly from higher energy prices—and the outlook for monetary policy. We also get the release of the Fed’s preferred inflationary gauge with core Personal Consumption Expenditures on tap Thursday. Stay nimble into the releases and watch the weekly closes here. Review my latest Gold Short-term Outlook for a closer look at the near-term XAU/USD technical trade levels.
Key US Economic Data Releases
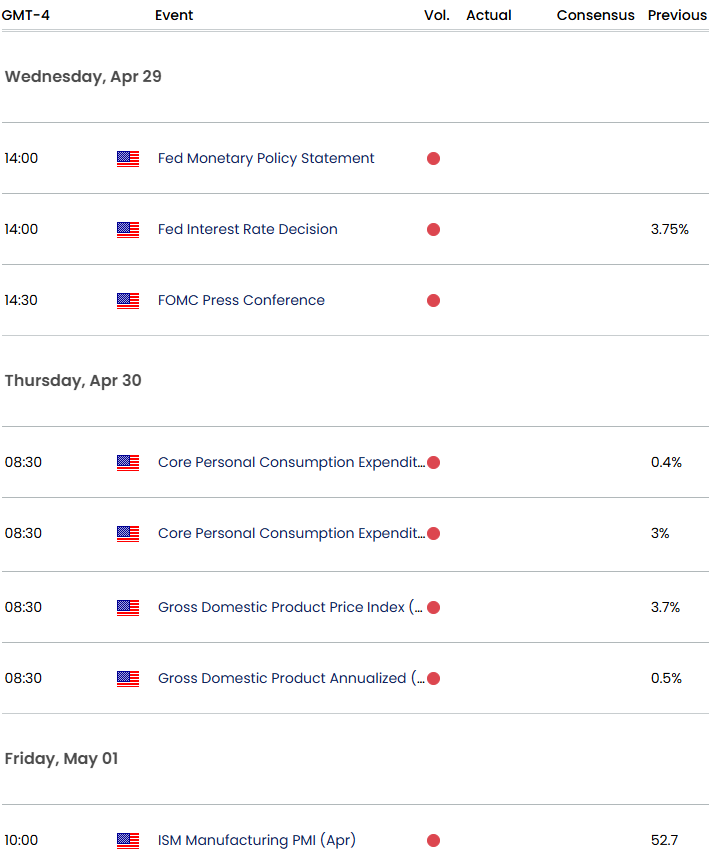
Economic Calendar - latest economic developments and upcoming event risk.
--- Written by Michael Boutros, Senior Technical Strategist
Follow Michael on X @MBForex






