



Gold Technical Outlook: XAU/USD Short-term Trade Levels
- Gold rebounded sharply after testing a major technical support zone at fresh monthly low.
- The recovery is now approaching the first major resistance hurdle within the broader downtrend- risk for price inflection ahead.
- A breakout above resistance would suggest a more significant low is in place while failure would keep focus on potential trend continuation.
- Resistance 4493-4533 (key), 4622, 4691-4716- Support 4384-4407 (key), 4319, 4224/52
Gold prices are rebounding sharply off the monthly lows after defending a critical technical support zone, raising the question of whether a more significant low may finally be in place. The recovery has improved near-term momentum following weeks of sustained selling pressure, but XAU/USD now faces its first major resistance test within the broader downtrend structure. The reaction here could prove decisive in determining whether this move develops into a larger reversal or stalls into another leg lower. Battle lines drawn on the XAU/USD short-term technical charts.
Gold Price Chart – XAU/USD Daily
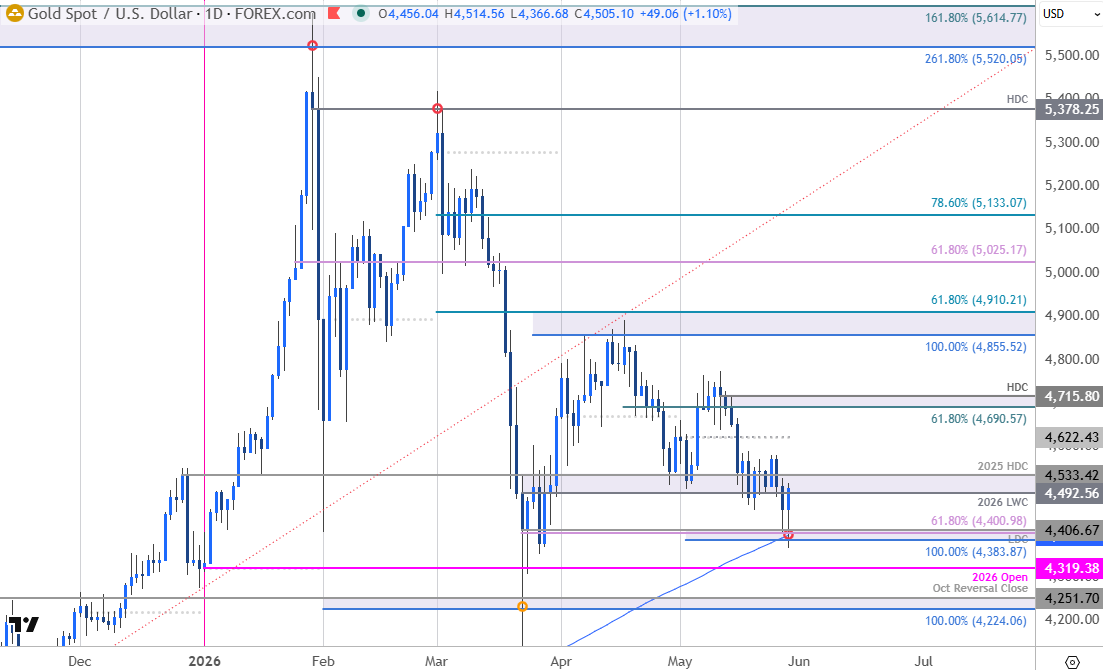
Chart Prepared by Michael Boutros, Sr. Technical Strategist; XAU/USD on TradingView
Technical Outlook: In my last Gold Short-term Outlook we noted that a rebound off key support was testing resistance and that, “From a trading standpoint, losses would need to be limited to 4605 IF price is heading higher on this stretch..” XAU/USD broke lower the following day with the decline extending into key technical support today at 4384-4407- a region defined by the 100% extension of the April decline, the 200-day moving average, the 61.8% retracement of the March rally , and the 2026 low-day close (LDC).
Gold has already rallied more than 3.3% off today’s low with the advance now approaching a major pivot zone and the first real test for the bulls at 4492-4533. This region is defined by the 2026 low-week close, the April low, the May opening range lows, and the 2025 high-day close. The focus is on a reaction off this mark in the days ahead with a breach / close above needed to suggest a more significant low may be in place and a larger reversal is underway.
Gold Price Chart – XAU/USD 240min
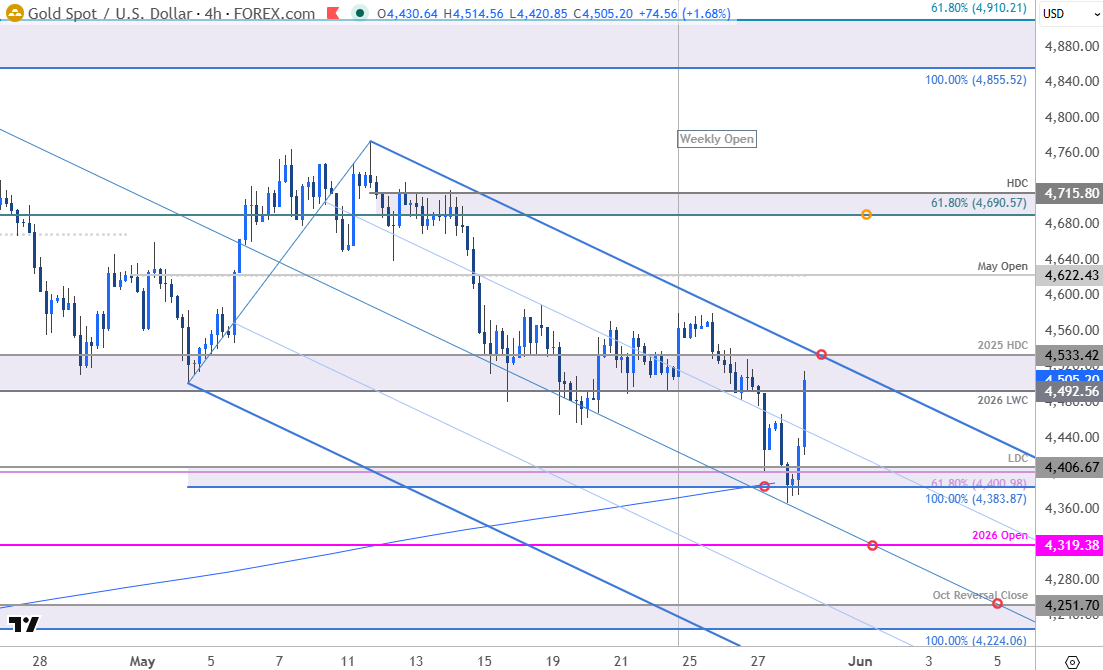
Chart Prepared by Michael Boutros, Sr. Technical Strategist; XAU/USD on TradingView
Notes: A closer look at gold price action shows XAU/USD trading within the confines of a descending pitchfork extending off the monthly high with the upper parallel further highlighting near-term resistance at 4492-4533. A breakout of this formation exposes subsequent resistance objectives at the monthly open at 4622 with key resistance eyed at the 61.8% retracement of the April decline and the May high-day close (HDC) at 4691-4716- look for a larger reaction there IF reached.
A break below this pivot support zone would threaten resumption of the multi-monthly downtrend with subsequent support objectives seen at the yearly open at 4319 and 4224-51- a defined by the 100% extension of the broader February decline and the October reversal close. Note that the median line converges on this zone next week.

Bottom line: Gold has responded to key technical support with the recovery now approaching confluent downtrend resistance. Risk for inflection into this zone over the next few days. From a trading standpoint, losses would need to be limited to 4383 IF price is heading higher on this stretch with a close above 4533 needed to invalidate the downtrend and fuel the next leg of the recovery.
Keep in mind we are heading into the close of the month with U.S. Non-Farm Payrolls on tap next week. In the meantime, traders will remain focused on war headlines with reports now suggesting that the U.S. and Iran are close to signing a Memorandum of Agreement. The deal would secure safe commercial passage in the Strait of Hormuz and a cessation of hostilities as nuclear talks continue. Stay nimble here into the monthly cross and watch the weekly closes for guidance. Review my latest Gold Weekly Technical Forecast for a closer look at the longer-term XAU/USD trade levels.
Key US Economic Data Releases
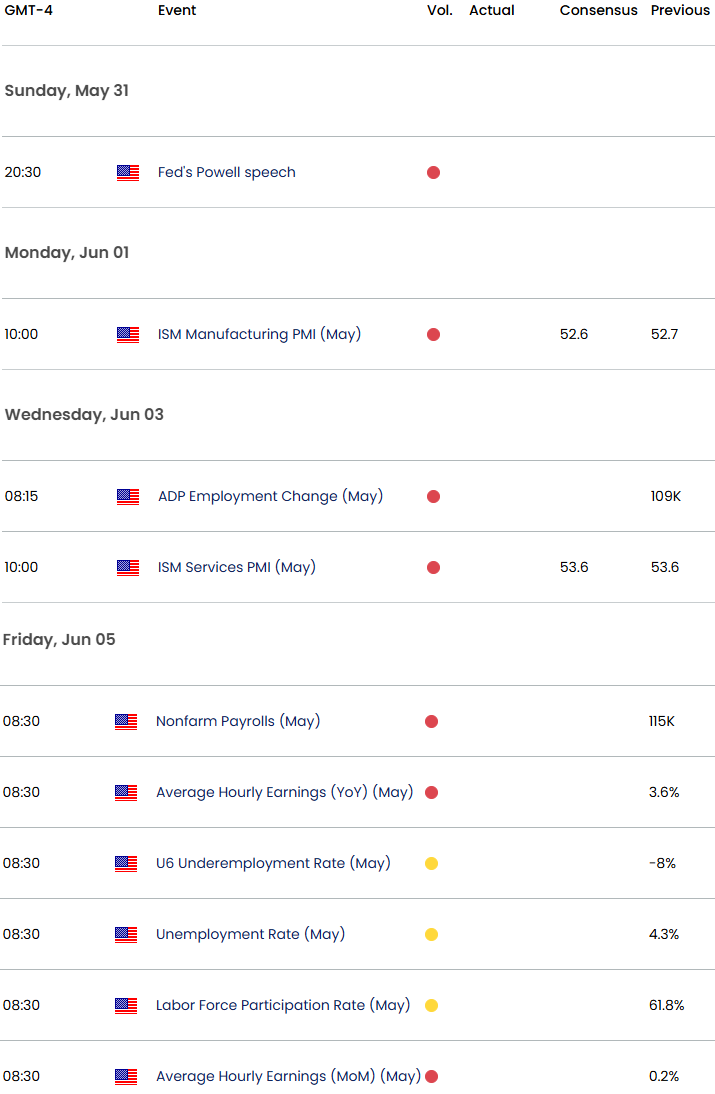
Economic Calendar - latest economic developments and upcoming event risk.
--- Written by Michael Boutros, Senior Technical Strategist
Follow Michael on X @MBForex






