



Japanese Yen Technical Forecast: USD/JPY Short-term Trade Levels
- USD/JPY has rebounded sharply after defending major support in early May.
- Price is holding a tight range just below a major resistance zone near the yearly highs.
- The threat of Japanese intervention remains elevated as price approaches prior intervention levels.
- Resistance 159.51, 160.22/74 (key), 161.69/95 - Support 158.55, 157.70/90 (key), 156.60/67
USD/JPY is consolidating in a tight range after rebounding sharply from key support earlier this month, with price action stabilizing just below major resistance near the yearly highs. The near-term technical outlook remains constructive, but traders are once again approaching levels that previously triggered Japanese intervention. This leaves the pair at a critical inflection point, where a breakout could fuel another leg higher while also increasing the risk of official action to curb further Yen weakness. Battle lines drawn on the USD/JPY short-term technical charts.
Japanese Yen Price Chart – USD/JPY Daily
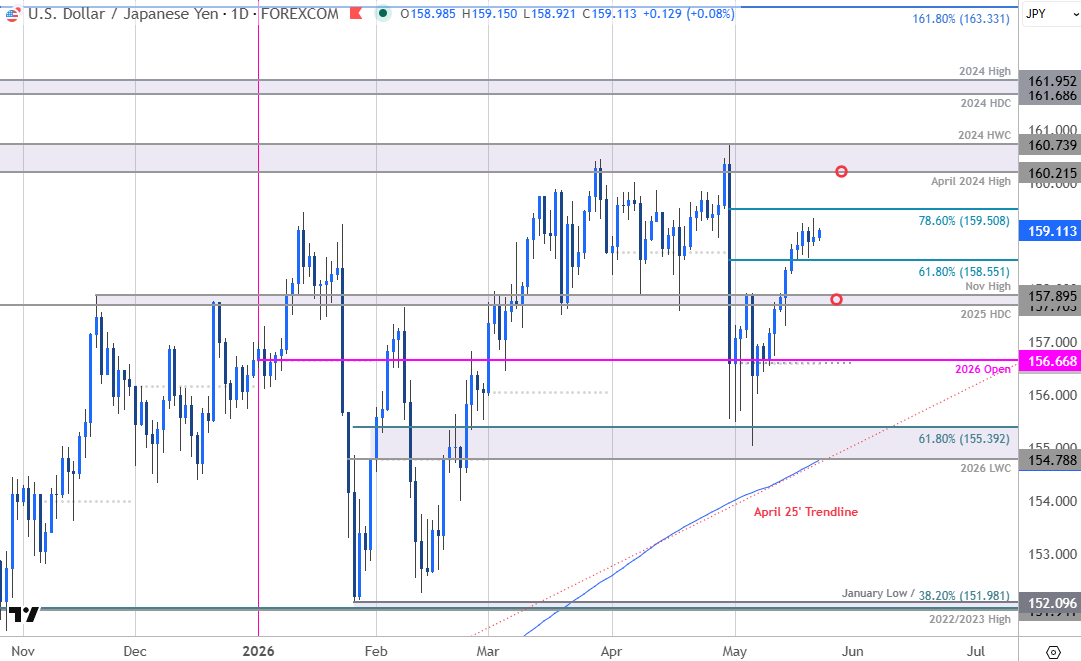
Chart Prepared by Michael Boutros, Sr. Technical Strategist; USD/JPY on TradingView
Technical Outlook: In last month’s Japanese Yen Short-term Outlook, we noted that USD/JPY was, “testing key resistance at the yearly high ahead of major event risk. From a trading standpoint, a good zone to reduce portions of long-exposure / raise protective stops – losses would need to be limited to the weekly open IF price is heading higher this stretch..” The resistance zone in focus was 160.22/74- a region defined by the April 2024 swing high, the March high, and the 2024 high-week close. USD/JPY briefly registered an intraday high at 160.73 the following day before Japanese officials intervened to mark a massive outside-day reversal off the yearly high4.
The decline extended more than 3.5% off the yearly high before rebounding off key support at the yearly low-week close and 61.8% retracement of the January rally at 154.79-155.40. USD/JPY rallied more than 2.7% off the May 6 low with price holding a tight range just above pivotal support. The focus is on a breakout in the days ahead with the looming threat of Japanese intervention ever present.
Japanese Yen Price Chart – USD/JPY 240min
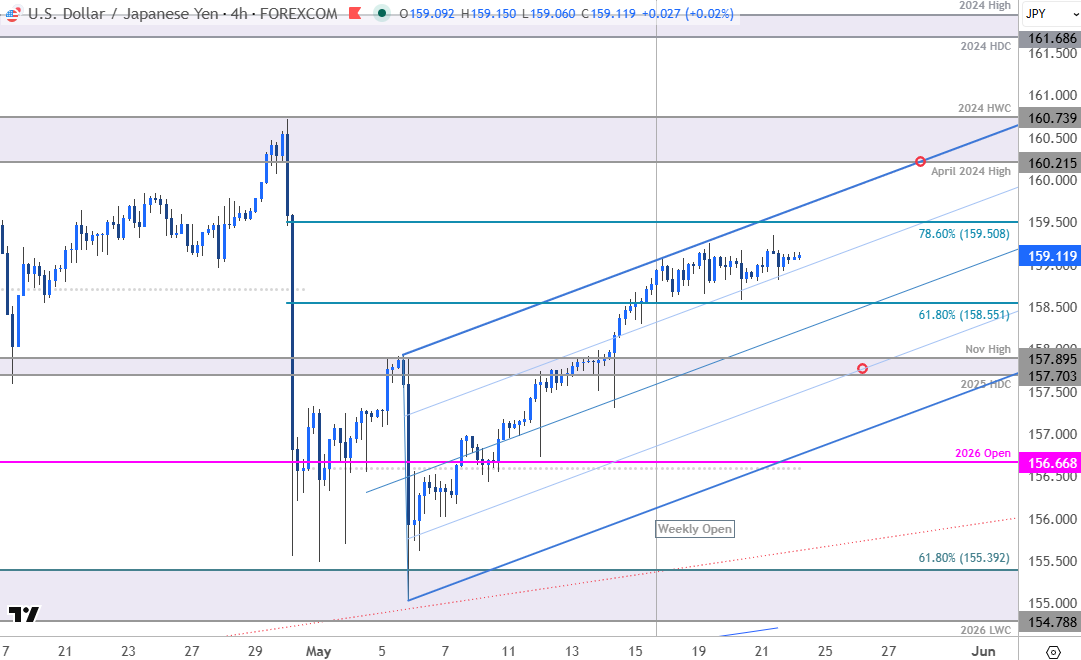
Chart Prepared by Michael Boutros, Sr. Technical Strategist; USD/JPY on TradingView
Notes: A closer look at Japanese Yen price action shows USD/JPY trading within the confines of an ascending pitchfork extending off the monthly low. A tight weekly opening range is preserved just above the 61.8% retracement of the April decline at 158.55. A break below this level would threaten a larger pullback within this near-term uptrend with subsequent support seen at the 2025 high-day close (HDC) and the November high at 157.70/90- look for a large reaction there IF reached. Broader bullish invalidation rests with the objective monthly & yearly open at 156.60/67.
Initial resistance is eyed at the 78.6% retracement at 159.51 with key resistance steady at 160.21/74. Ultimately, a breach / close above this zone would be needed to fuel the next major leg of the advance with the next technical consideration eyed at the 2024 high / high-day close at 161.69/95.

Bottom line: USD/JPY is in a tight range at the monthly high and while the near-term technical outlook remains constructive, the threat of intervention looms on this setup. From a trading standpoint, losses would need to be limited to 157.70 IF price is heading higher on this stretch with a close above 160.74 needed to fuel the next major leg of the rally.
Keep in mind we are heading into an extended holiday weekend with key U.S. and Japanese inflation data on tap next week. Stay nimble on this trade and watch the weekly closes for guidance. Review my latest Japanese Yen Weekly Forecast for a closer look at the longer-term USD/JPY technical trade levels.
Key Economic Data Releases
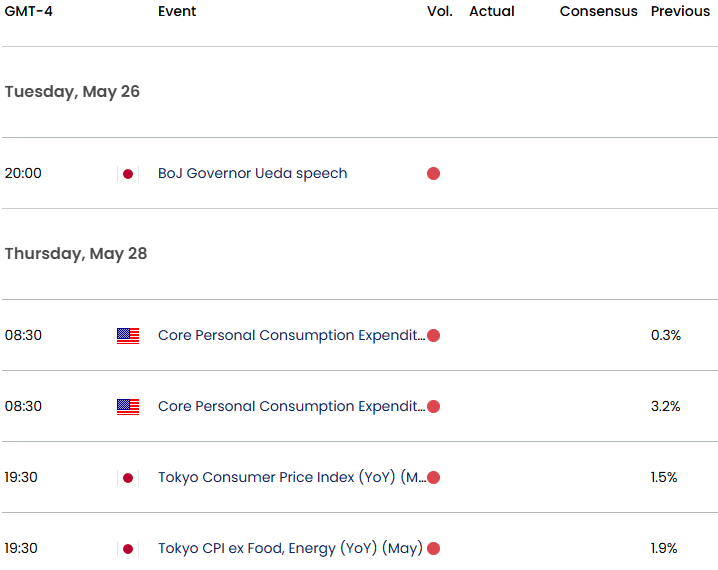
Economic Calendar - latest economic developments and upcoming event risk.
--- Written by Michael Boutros, Senior Technical Strategist
Follow Michael on X @MBForex






