



The week starts on a positive note for the Nasdaq 100, as the first session shows a gain of more than 1.5%, with price moving closer to the never-before-seen psychological area of 30,000 points. This move continues to reinforce the idea that the buying bias remains relevant in the short term.
Buying pressure has been supported mainly by optimism around the situation in the Middle East, which has boosted demand for risk assets. If this confidence environment holds, the dynamic could continue to support important buying pressure in Nasdaq over the coming trading sessions.

Middle East situation calms markets
The weekend was relevant for risk sentiment across global markets, after comments from President Trump suggested that a potential agreement with Iran was progressing in an orderly and constructive way. The market has reacted positively to the possibility of an agreement that could reduce geopolitical risk and eventually lead to the reopening of the Strait of Hormuz, which would lower the risk premium that has been present in recent weeks.
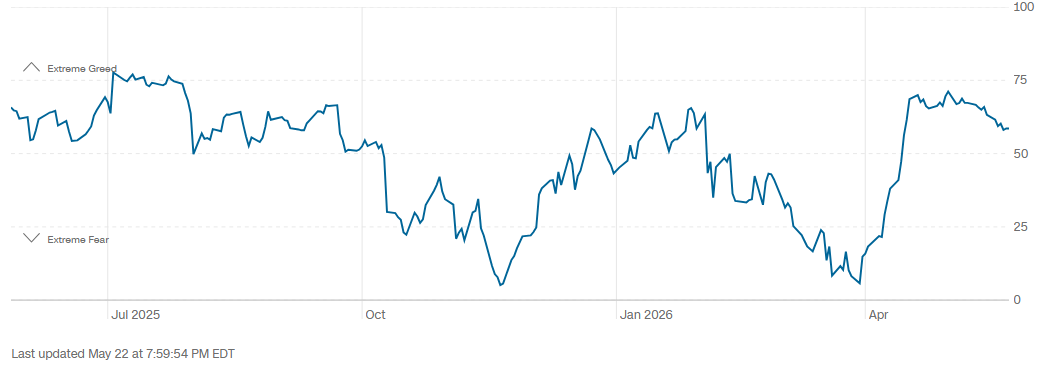
This situation has revived market optimism. This can be seen in the Fear and Greed Index, which has stopped declining near the 59-point area and remains stable within “greed” territory. Although this does not reflect an extraordinary recovery, it does show some stability in market confidence, which could once again support appetite for risk assets such as Nasdaq.
Source: CNN
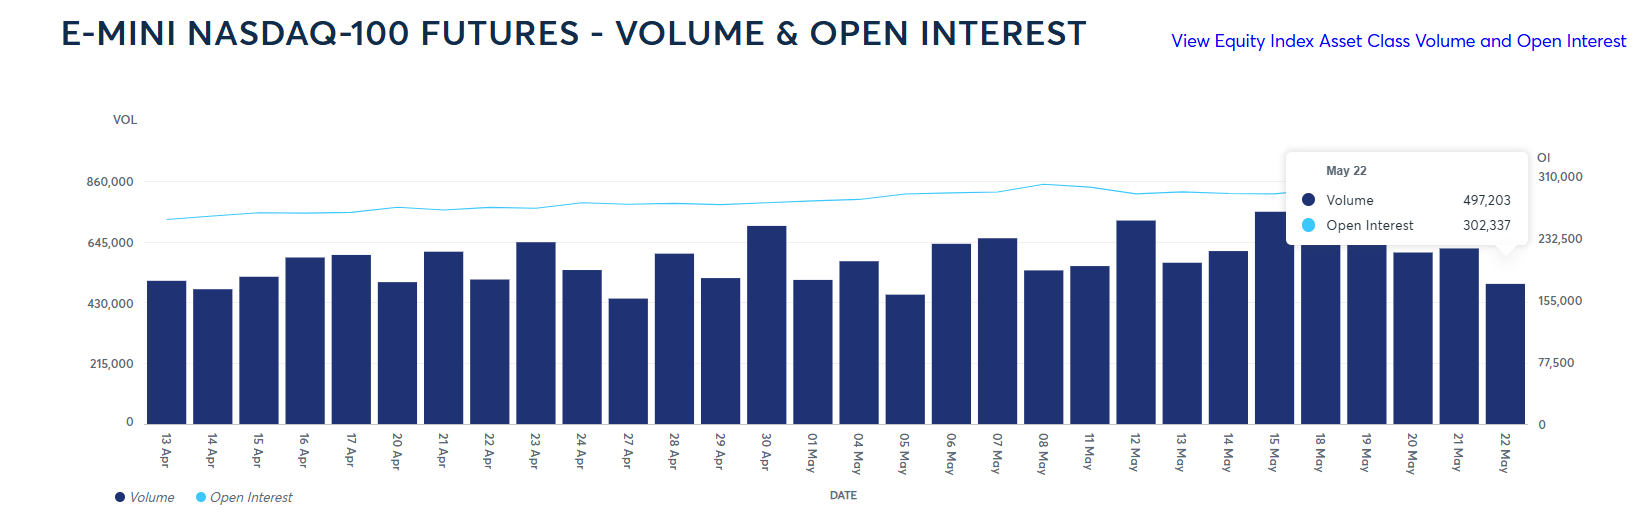
It is also important to note that demand in Nasdaq futures had already been showing stability in previous sessions. Trading volume as of the May 22 close remained near 500,000 contracts, while Open Interest, which measures the total number of open long and short positions, stood at monthly highs above 300,000 contracts.
The fact that this indicator continues to rise alongside the Nasdaq price suggests that long positions have continued to enter the market consistently in recent sessions. This already pointed to stable demand before the renewed optimism around the Middle East, meaning this environment could further reinforce the buying pressure seen toward the end of last week.
Source: CMEGROUP
With this in mind, in addition to the improvement in short-term confidence driven by optimism around the Middle East, Nasdaq had already been showing important advances in demand dynamics. For this reason, this renewed confidence could strengthen the demand already seen in previous sessions and help maintain relevant buying pressure in the short term.
How is the long-term dynamic holding up?
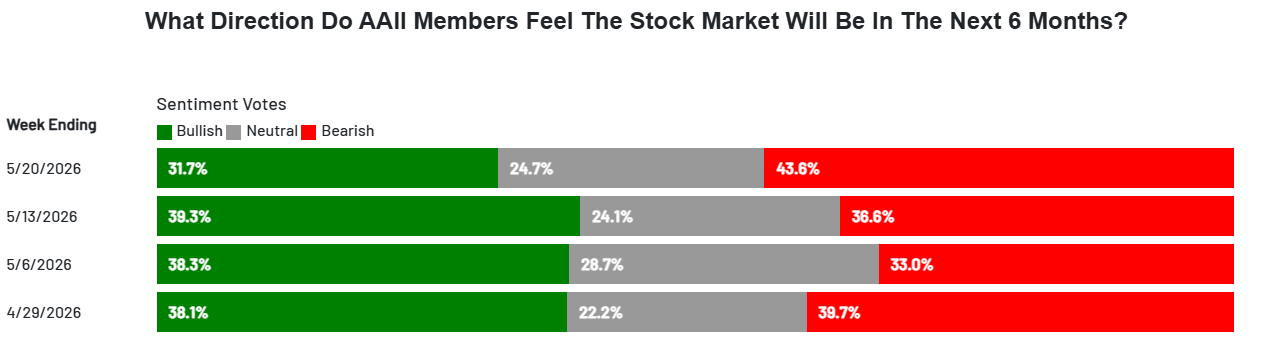
Beyond the current short-term confidence environment, the real challenge for the equity market remains long-term perception. According to the latest data from the AAII Investor Sentiment Survey, as of May 20, 2026, the six-month outlook for the stock market stands at 31.7% bullish, 24.7% neutral, and 43.6% bearish.
These figures show a meaningful decline in confidence compared with the week ending May 13 and suggest that, for now, the market still does not show an optimal confidence environment for equity indices such as Nasdaq over the coming months.
Source: AAII
This factor is key because, if long-term sentiment remains in bearish territory, it could be difficult to sustain consistent demand in the equity market. In this scenario, indices such as the Nasdaq 100 could face greater long-term doubts, which may also warn of potential phases of indecision over the coming weeks.
Technical outlook for the Nasdaq 100
Source: StoneX, Tradingview
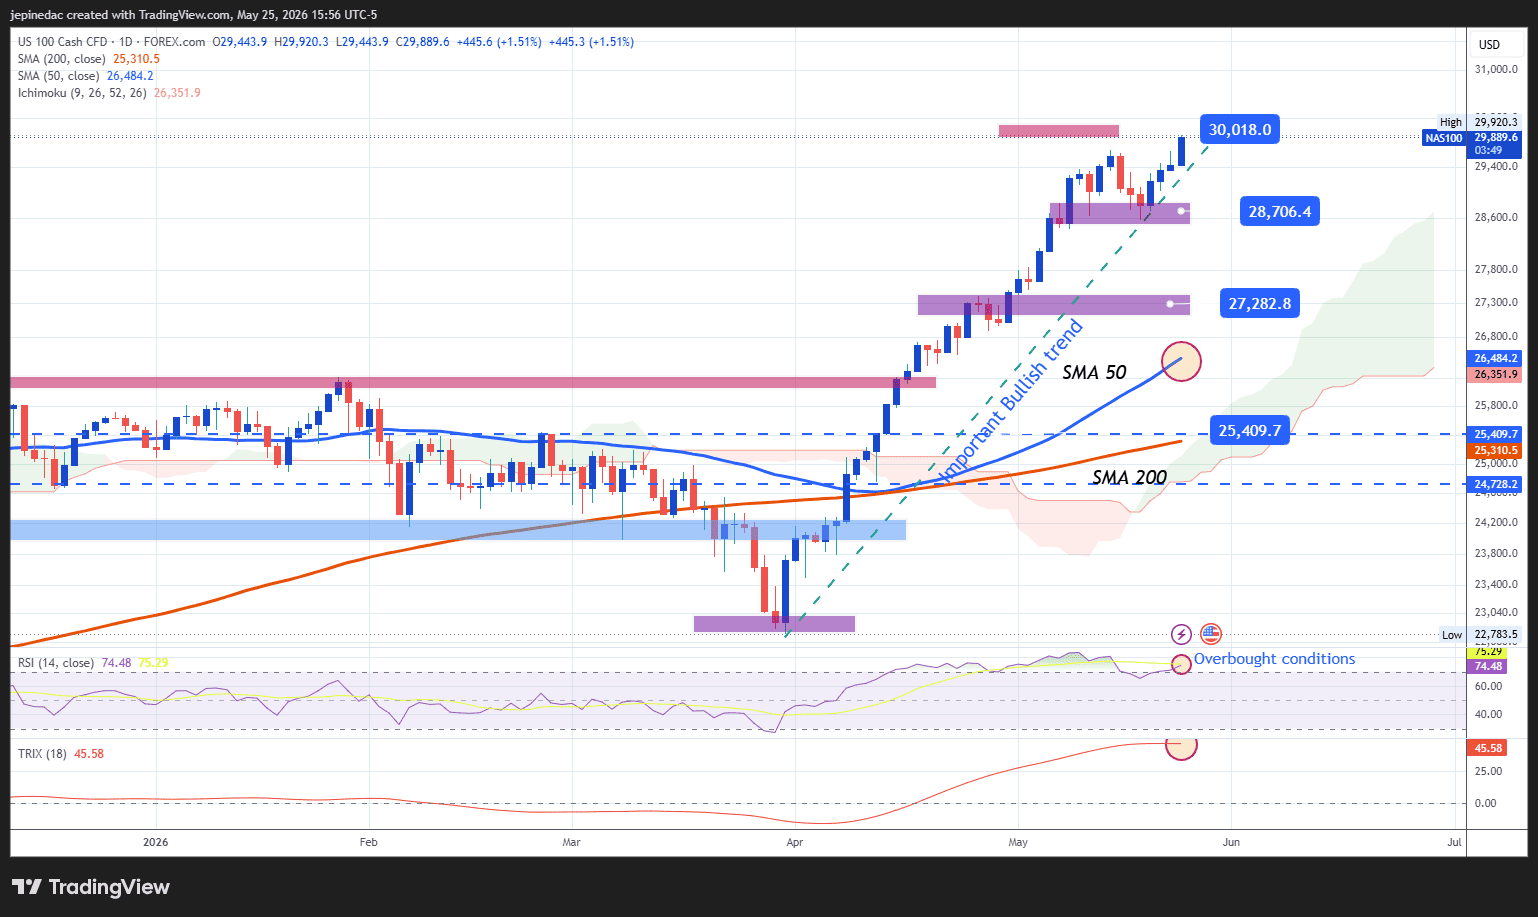
- Aggressive trendline remains intact: Recent Nasdaq price action has managed to maintain an aggressive bullish trendline that has been in place since the final days of March. As long as no relevant selling moves appear, this structure remains the most important technical factor to watch and could continue to dominate the index’s movements over the coming sessions. However, the speed at which price continues to reach new all-time highs may also leave room for potential bearish corrections in the short term.
- TRIX: The TRIX indicator continues to hold near relevant highs and, for now, shows no major declines. This indicates that the average strength of long-term exponential moving averages continues to reflect a relevant buying bias, which could remain part of Nasdaq price action as long as the TRIX line does not show significant weakness.
- RSI: The RSI continues to show that bullish momentum dominates the chart, but it also remains near the overbought zone around 70. This suggests an imbalance caused by excess short-term buying strength, which may warn of room for possible selling corrections over the coming sessions.
Key levels:
- 30,000 points – Relevant resistance: A key psychological level given the lack of historical references. A sustained breakout above this area could reinforce the bullish bias and allow the current trend to remain the dominant pattern on the chart in the coming sessions.
- 28,700 points – Near-term barrier: A recent retracement level that acts as the immediate support to watch. This area could serve as a tentative barrier if selling corrections begin to appear in the Nasdaq over the coming sessions.
- 27,280 points – Key support: A nearby low zone that stands as a relevant neutrality level. Price movements toward this area would not only put the current aggressive bullish trendline into question but could also open the door to a more consistent phase of indecision in the coming sessions.
Written by Julian Pineda, CFA, CMT – Market Analyst
Follow him on: @julianpineda25






