



The week continues to show a positive bias for US equity markets, and among them, the Nasdaq 100 stands out, as it has posted a gain of more than 5.00% on average over the last five trading sessions. This move has once again pushed the index to new all-time highs, bringing it closer to the 29,000 level in the short term.
Part of the buying pressure seen in recent sessions can be explained by an improvement in market sentiment, driven both by developments on the geopolitical front in the Middle East and by the release of positive corporate earnings. In this context, the dominant bias remains bullish, suggesting that demand could continue to be relevant in the coming sessions.

Calm in the Middle East
In recent trading hours, new information has emerged pointing to a potential de-escalation of the conflict in the Middle East. The United States has strengthened direct communication channels with Iran and has also suspended certain operations related to securing the passage of vessels through the Strait of Hormuz.
President Trump has mentioned that meaningful progress has been made toward a more formal agreement in the short term, which has been interpreted as a signal of reduced geopolitical tensions.
This scenario not only suggests a lower probability of further escalation but has also reduced the risk premium that had been affecting markets in previous weeks. As a result, confidence has begun to recover, supporting demand for risk assets such as Nasdaq.
This shift in sentiment is reflected in the behavior of the CNN Fear and Greed Index, which has rebounded toward the 68 level, moving closer to the “extreme greed” zone. This indicates that market perception has become more optimistic in the short term.
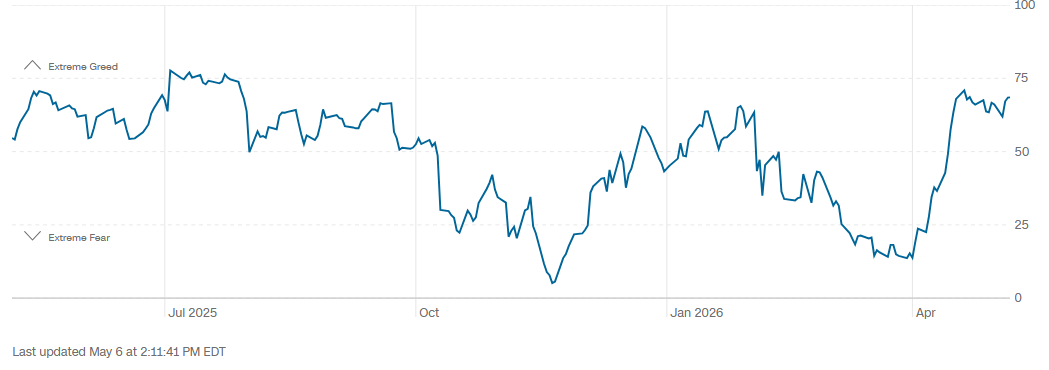
Source: CNN
In this context, the improvement in confidence has created a more favorable environment for Nasdaq demand. However, this dynamic still depends on the progress of negotiations. If an agreement is reached, buying pressure could persist; but any deterioration in the geopolitical outlook could quickly reverse this scenario.
AMD supports demand
Another relevant factor for Nasdaq has been the earnings release from AMD. The company reported an EPS of $1.37 versus $1.29 expected, and revenue of $10.25 billion versus $9.89 billion estimated.
In addition, the company highlighted that growth has been driven primarily by demand for artificial intelligence chips and expects this trend to continue in the coming months.
Although AMD is not part of the top 5 index components, its results reinforce the growth narrative within the technology sector, particularly in semiconductors. This has helped strengthen confidence in key Nasdaq companies, reflected in positive moves across names such as Nvidia (+5.03%), Apple (+0.95%), Microsoft (+0.62%), Amazon (+1.54%), and Alphabet (+2.09%).
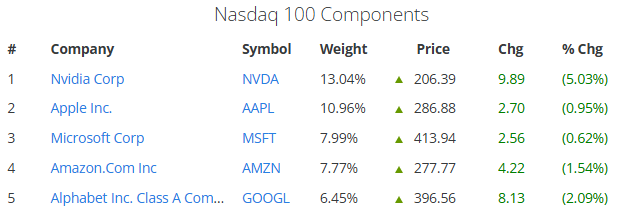
Source: Slickcharts
With this in mind, the narrative remains clear: as long as major tech companies continue to deliver strong results and maintain growth expectations, especially linked to artificial intelligence, demand for Nasdaq could remain solid.
The market is now focused on upcoming key earnings, such as Nvidia’s on May 20. If this positive trend continues, buying pressure in the index could remain relevant in the coming weeks.
Technical outlook for the Nasdaq 100
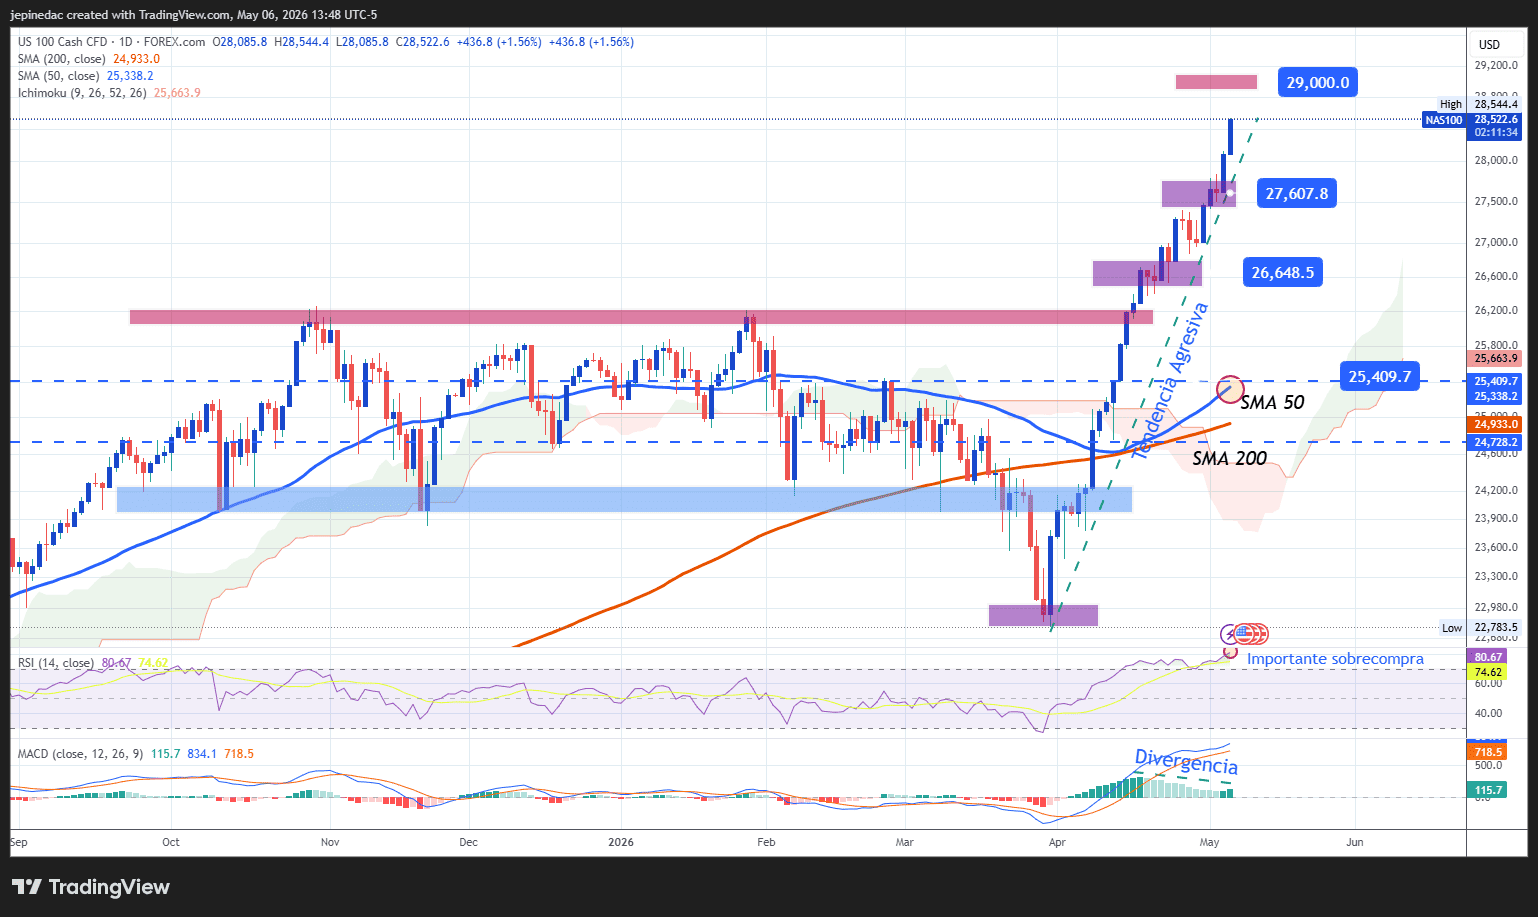
Source: StoneX, Tradingview
- Aggressive trendline remains intact: Since late March, Nasdaq has developed a short-term upward trendline that continues to be the dominant technical structure. As long as the price respects this formation, the bullish trend may continue to guide price action in the search for new highs. However, it is important to note that the recent pace of the move has been quite strong, which could create imbalances and open the door to short-term corrections.
- MACD: The MACD indicator is showing a bearish divergence, with lower highs in the histogram while the Nasdaq price continues to post higher highs. This signal may be warning of a loss of momentum and the potential for downside corrections in the coming sessions.
- RSI: Similarly, the RSI is currently in overbought territory above 70, indicating an excess of buying pressure and also pointing to the possibility of short-term pullbacks as the market shows signs of imbalance.
Key levels:
- 29,000 points – Key resistance: A key psychological level given the lack of historical references. A sustained break above this area could reinforce the bullish bias and extend the current trend in the coming sessions.
- 27,600 points – Near-term barrier: A recent retracement level that stands as a key reference in the event of short-term corrections. The reaction around this area will be important to assess the strength of the current move.
- 26,648 points – Key support: A zone of recent lows that acts as the main downside barrier. A move toward this level could challenge the strength of the current uptrend and open the door to a phase of indecision or consolidation in the short term.
Written by Julian Pineda, CFA, CMT – Market Analyst
Follow him on: @julianpineda25






