Equity Indices Technical Forecast: Weekly Trade Levels
- U.S. equities were lower across the board this week with the S&P 500, Nasdaq, and the Dow down 1.4%, 2% and 2.1% respectively
- S&P 500 marks fourth-consecutive weekly decline with the index falling nearly 7.7% off the yearly high- now testing pivotal support.
- Nasdaq falls to the lowest levels since September with a decline of more than 9.1% off the yearly high- now testing pivotal support.
- Dow posts fourth consecutive weekly decline with a loss of more than 10.1% off the yearly high- now testing 52-week moving average with key support in view just lower
- Headline risk is prominent with the announcement of a potential end to the ongoing war in Iran.
S&P 500 Price Chart – SPX500 Weekly
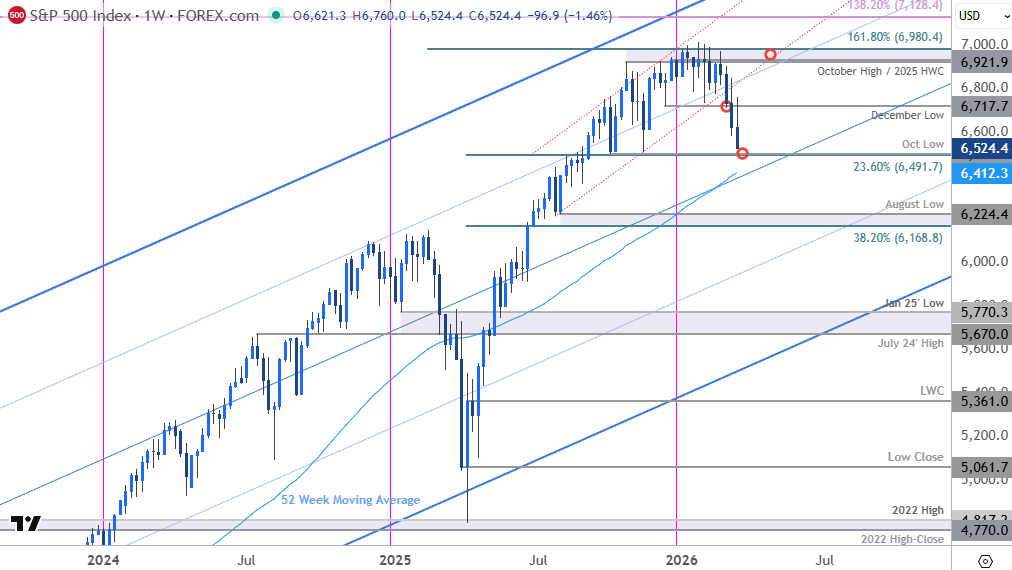
Chart Prepared by Michael Boutros, Sr. Technical Strategist; S&P 500 on TradingView
Technical Outlook: In last month’s Equity Indices Forecast we noted that the S&P 500 was, “consolidating within the February range. The focus is on a breakout heading into March with the multi-month uptrend vulnerable while below resistance.” The index broke below support two-weeks later with a decline of more than 7.4% off the yearly high marking a fourth-consecutive weekly loss on Friday for the first time since March of 2025. The sell-off is now testing lateral support and the focus is on a reaction off this mark into the start of the week.
S&P 500 Price Chart – SPX500 Daily
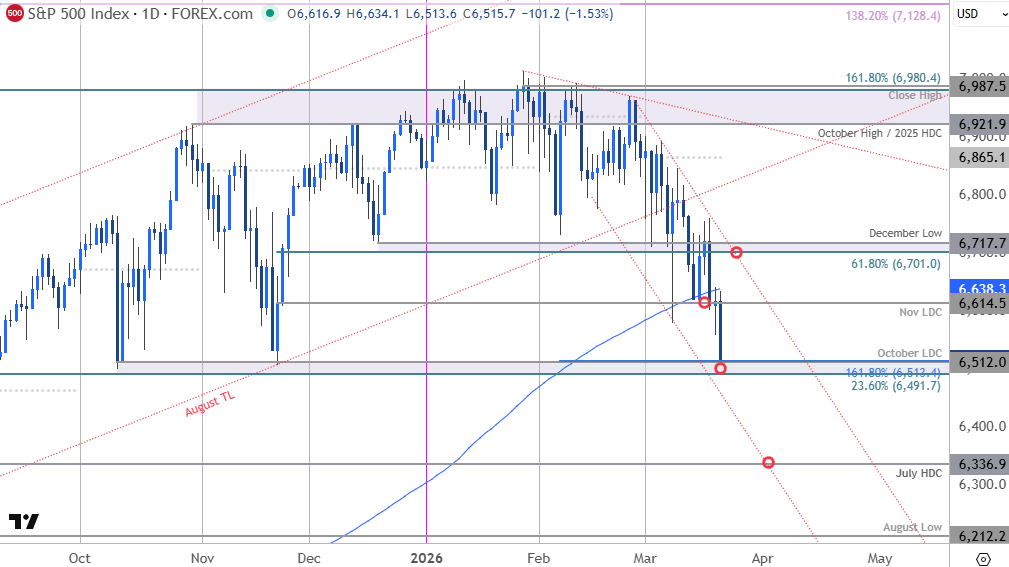
Chart Prepared by Michael Boutros, Sr. Technical Strategist; S&P 500 on TradingView
A closer look at the S&P 500 daily chart shows the index trading within a descending channel with the sell-off halting at pivotal support at 6492-6512- a region defined by the 23.6% retracement of the 2025 advance, the November swing low, the October low-day close (LDC) and the 1.618% extension of the January decline. A break / daily close below this threshold would suggest a more significant correction is underway with subsequent support objectives eyed at the July high-day close (HDC) at 6337 and the August swing low at 6212.
Initial resistance is eyed at the November LDC 6614 and is backed closely by the 200-day moving average at 6638. Key resistance / bearish invalidation is now lowered to the 61.8% retracement of the November rally and the December swing low at 6701/17. A breach / daily close above this threshold would be needed to invalidate the January downtrend and would suggest a more significant low is in place.
Bottom line: The S&P 500 is trading just above pivotal support at five-month lows, and the focus is on possible inflection off this zone. Note that daily RSI has fallen to the lowest levels since April of last year and for now keeps the momentum profile in favor of the bears. From a trading standpoint, the threat remains lower while below the 200-day moving average with a close below 6492 needed to fuel the next leg of the decline. Keep in mind that sentiment has turned over rather aggressively here and we are on the lookout for a potential exhaustion low in the weeks ahead- stay nimble here.

Nasdaq Price Chart – NDX Weekly
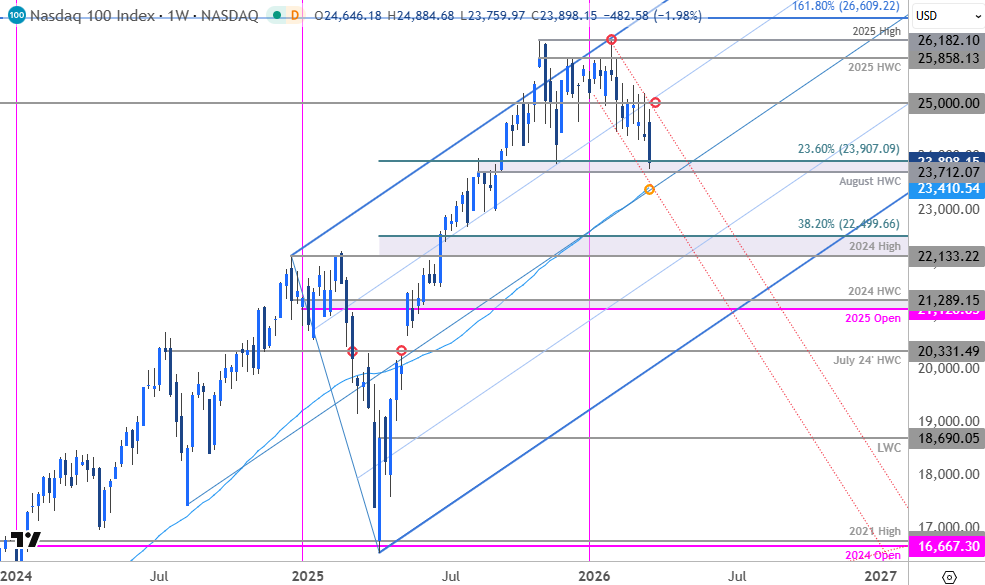
Chart Prepared by Michael Boutros, Sr. Technical Strategist; NDX on TradingView
Technical Outlook: The Nasdaq fell nearly 2% this week with the decline taking the index into support at the August high-week close (HWC) and the 23.6% retracement of the 2025 advance at 23,712/907. The immediate focus is on a reaction off this threshold next with a break lower exposing the 52-week moving average at ~23,410. Note that the median-line converges on this level next week and a break / weekly close below this slope would threaten a more significant correction in the Nasdaq. The next major technical consideration rests with the 2024 swing high and the 38.2% retracement at 22,133/499- look for a larger reaction there IF reached.
Weekly resistance is now eyed at 25,000 with a break above the January channel needed to suggest a more significant low is in place and a larger trend reversal is underway. Subsequent resistance objectives are eyed at the 2025 high-week close (HWC) at 25,858 and the 2025 swing high at 26,182.
Bottom line: Nasdaq has dropped into pivotal support, and the immediate focus is on a reaction off this mark next week. Daily RSI is near last month’s low and the momentum profile is not quite as ominous as the other indices. From a trading standpoint, the threat remains weighted to the downside while below 25K with a break / close below the 52-week moving average needed to fuel the next major leg of the decline.
Dow Jones Price Chart – DJI Weekly
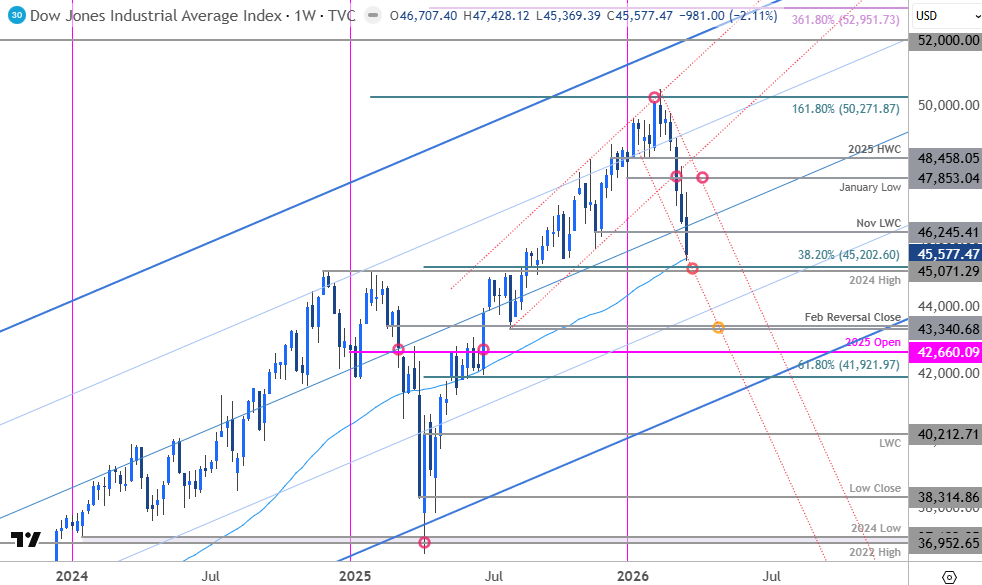
Chart Prepared by Michael Boutros, Sr. Technical Strategist; DJI on TradingView
Technical Outlook: The Dow was the worst performing index with a four-week decline halting on Friday at the 52-week moving average, currently near ~45,446. A major technical pivot zone rests just lower at the 2024 swing high and the 38.2% retracement of the 2025 advance at 45,071/202. Note that channel support converges on this threshold next week and represents an area of interest for possible downside exhaustion / price inflection- look for a larger reaction there IF reached. Losses below this threshold would threaten another bout of accelerated declines with the next major technical consideration seen at the July low and February reversal close near 43,341/428.
Look for initial weekly resistance near the November low-week close (LWC) at 46,245 with medium-term bearish invalidation at the January low at 47,853. Ultimately, a break / weekly close above the 2025 HWC at 48,458 would be needed for the bulls to reassert control here.
Bottom line: The Dow is testing the yearly moving average here with more significant technical support seen just lower. Note that daily RSI dropped into oversold condition last week and the momentum profile is most vulnerable out of the three major indices. From a trading standpoint, look to reduce short-exposure / lower protective stops on a drop towards 45,071/202- rallies would need to be limited to last week’s high IF the index is heading lower on this stretch with a close below channel support needed to fuel the next major leg of the decline.
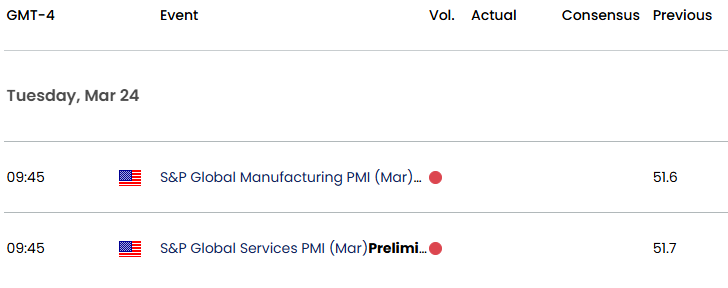
Keep in mind that the economic docket is rather light next week and Iranian war headlines will likely drive sentient in the days ahead. In a Truth Social post after the close on Friday, President Trump noted that, “We are getting very close to meeting our objectives as we consider winding down our great Military efforts in the Middle East with respect to the Terrorist Regime of Iran.” If a resolution is announced, the markets may rebound sharply as concerns over rising energy prices abate and relief rally could provide a decisive low to trade against. Keep an eye on the headlines and watch the weekly closes for guidance here.
Key US Economic Data Releases
--- Written by Michael Boutros, Senior Technical Strategist
Follow Michael on X @MBForex