

Recent sessions have started to show a more neutral tone in SPX price action, with the index hovering around its all-time highs and displaying consistent sideways movement. In fact, the average price variation over the last four trading sessions has been just 0.5%, with no clear short-term direction.
This new phase of indecision in the equity index appears to be driven by a growing sense of caution in the market, largely linked to ongoing uncertainty surrounding the Middle East conflict. This environment seems to have slowed the previously rising confidence, suggesting that this caution could translate into a more persistent indecision phase in SPX price action in the coming sessions.

Demand begins to slow down
Market confidence has started to shift into a more cautious phase, as new comments from Iran suggest that a full reopening of the Strait of Hormuz is not possible while US blockades remain in place. So far, no meaningful progress has been made in negotiations, with both sides maintaining relatively firm positions, leaving the short-term outlook unclear.
This situation is starting to dampen the steady rise in market confidence seen in recent weeks, a shift already reflected in the CNN Fear and Greed Index, which has edged lower and now hovers around the 66 level, pulling back from the 75 mark that signals “extreme greed.” Overall, this points to momentum in market confidence beginning to ease in the short term.
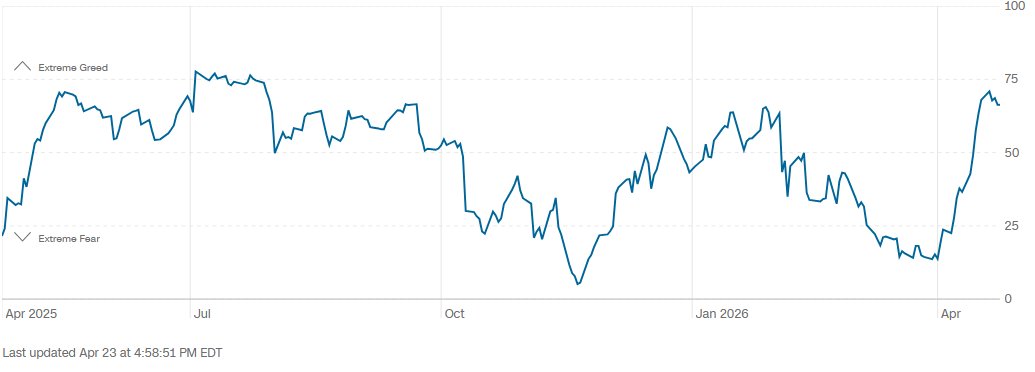
Source: CNN
This dynamic has started to moderate demand in the short term, as risk appetite has stabilized and given way to a more cautious approach to capital inflows. This can be seen in the behavior of the SPY ETF, which tracks the S&P 500, where capital inflows have declined in recent sessions up to the April 21 cutoff.
Although inflows remain positive, they are significantly lower compared to previous weeks. For instance, flows on April 21 were around $1.5 billion, well below levels seen on April 9, when inflows exceeded $7 billion. This indicates that, while demand has not disappeared, it has started to show a notable slowdown in the short term.
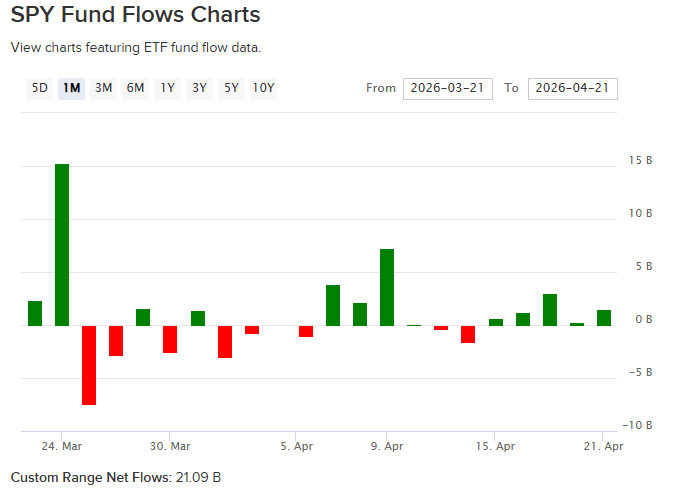
Source: ETFDB.COM
In this context, the pause in confidence, driven by Middle East uncertainty, has reduced appetite for risk assets and has started to generate a phase of indecision in the S&P 500. This environment could persist as long as there are no clear updates on the conflict, reinforcing a neutral short-term outlook.
Long-term confidence shows meaningful changes
From a broader perspective, what has started to shift more noticeably is long-term confidence. According to the AAII Investor Sentiment Survey, data as of April 22 shows a meaningful recovery, with bullish sentiment rising to 46%, compared to 31.7% the previous week regarding expectations for the next six months.
While this bias is not yet fully dominant, it does reflect a significant improvement in long-term market expectations.
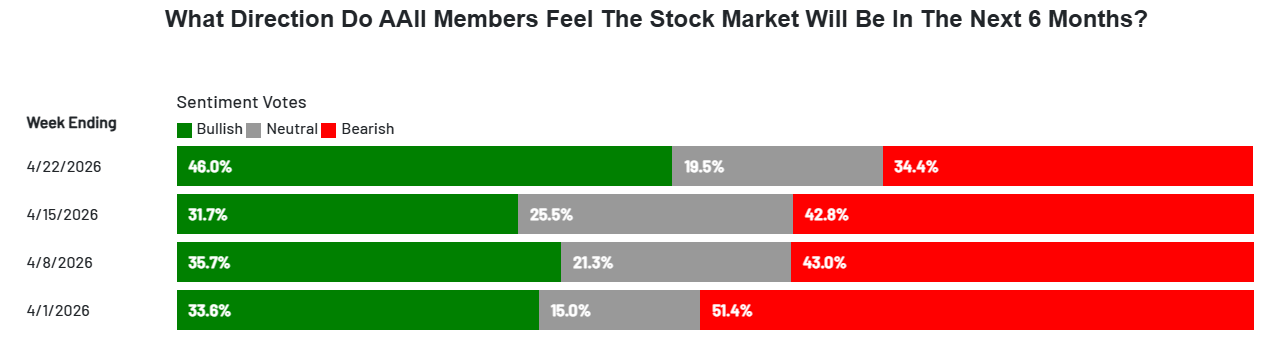
Source: AAII
This is relevant because it suggests that, despite short-term caution, the bullish bias still carries weight over a longer horizon. If these indicators continue to show solid optimism, conditions may remain in place for buying pressure to stay relevant in SPX price action in the coming months.
Technical outlook for the S&P 500
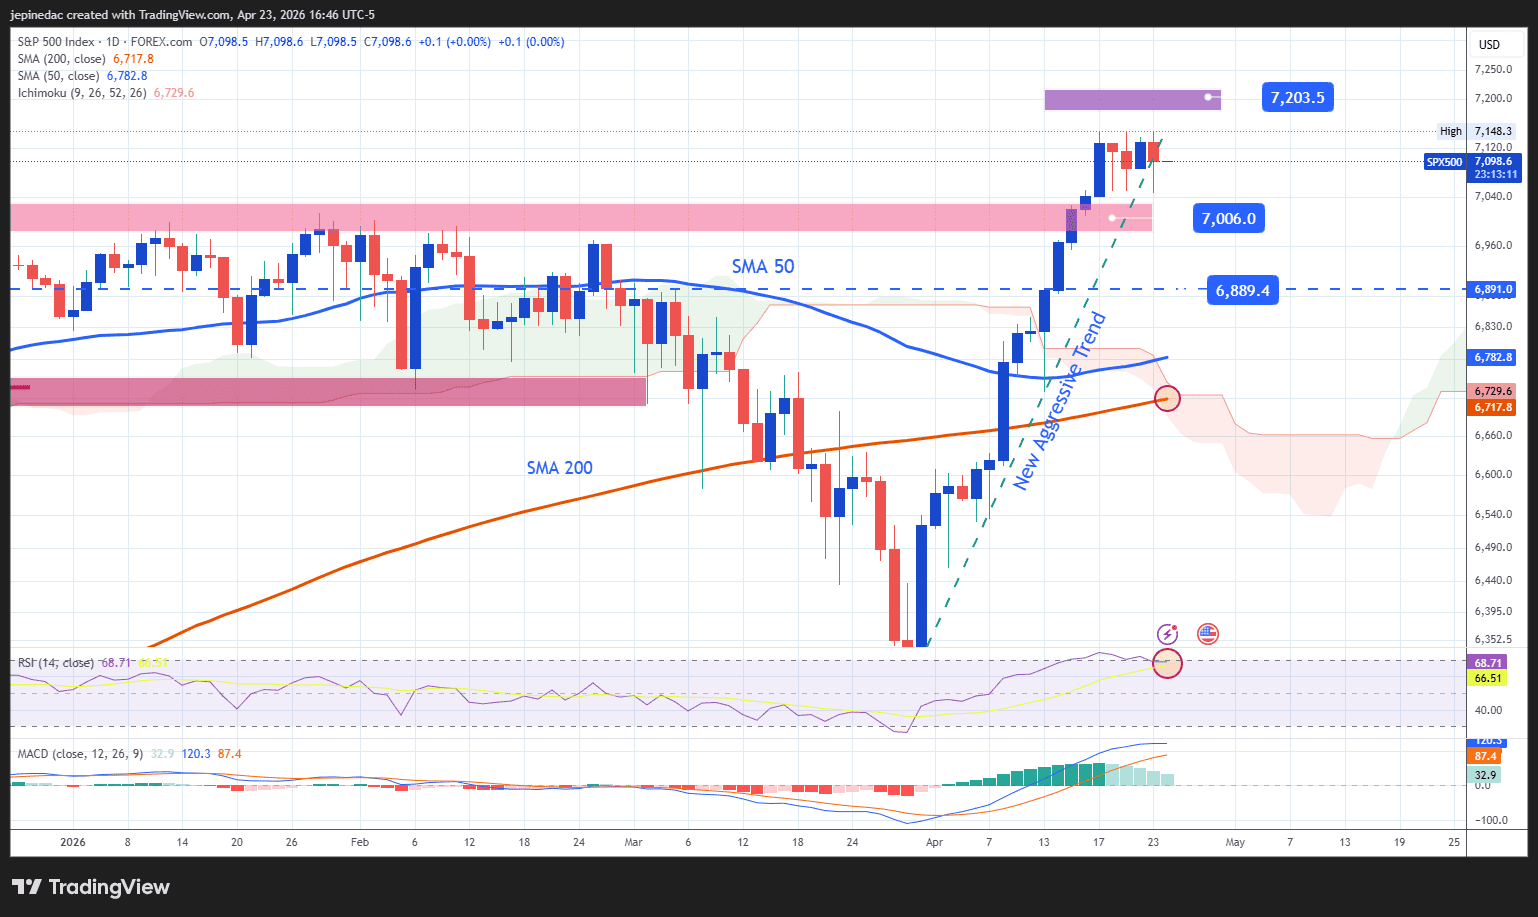
Source: StoneX, Tradingview
- Bullish momentum begins to stall: Although the SPX had been showing a strong upward move since late March, one that even led to the formation of a steep short-term trendline, this momentum now appears to be losing strength. Price action has started to show clearer sideways behavior, which could put the previous bullish structure at risk and open the door to the formation of a short-term range.
- MACD: The MACD indicator has started to show a histogram approaching the zero level, suggesting a balance in short-term moving average strength. This supports the idea that an indecision bias could become more relevant in the coming sessions.
- RSI: The RSI shows a similar pattern, with the line pulling back from overbought levels near 70, reflecting a loss of bullish momentum. If this trend continues, neutrality could become the dominant theme in the short term.
Key levels:
- 7,200 points – Key resistance: With limited historical references above current levels, this area stands out as the nearest psychological barrier. A move above it could reinforce a more aggressive bullish bias and support trend continuation.
- 7,000 points – Near-term barrier: A key psychological level that previously acted as the all-time high zone. It may now serve as a reference point for potential short-term corrections.
- 6,900 points – Key support: A zone aligned with relevant retracement levels from previous months. A move toward this level could weaken the current structure and open the door to a more pronounced bearish bias in the coming sessions.
Written by Julian Pineda, CFA, CMT – Market Analyst
Follow him on: @julianpineda25