



The ASX 200 posted its strongest daily gain in six weeks after weak Australian employment data sharply reduced expectations for another RBA rate hike. Falling yields and a positive lead from Wall Street helped lift sentiment, while technical signals suggest the index may be attempting to carve out a swing low near 8500.
View related analysis:
- Japanese Yen Outlook: USD/JPY Stalls While JPY Crosses Turn Choppy
- Crude Oil Outlook: Brent Teases Bears at Elevated Prices
- How to Read the COT Report to Track Forex Market Sentiment
- ASX 200 Outlook: SPI Futures Rebound, But Resistance Looms Into Expiry
- ASX 200 Outlook: ASX 200 Seeks Bounce Despite Rising Bearish Open Interest
ASX 200 Rebounds as Traders Slash RBA Hike Expectations
A positive lead from Wall Street and heavily reduced bets on a June RBA hike helped the ASX 200 enjoy its best day in six weeks. Bad news is clearly good news where the ASX is concerned, with weak employment figures crushing expectations for a 25bp hike to 4.6%, while some are even questioning whether the RBA’s modest 75bp tightening cycle has already peaked.
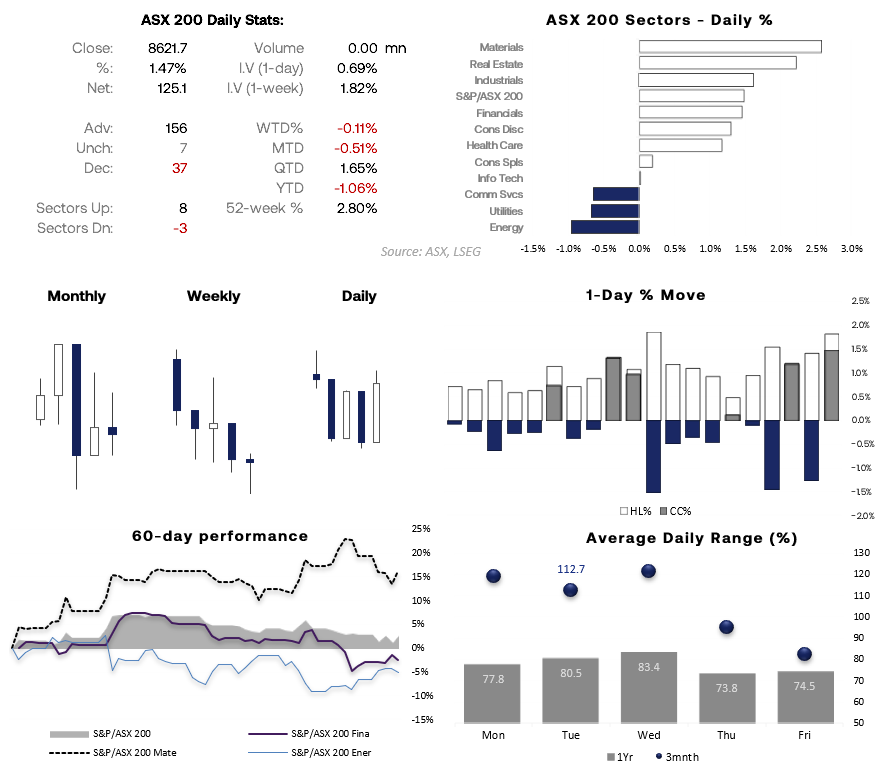
ASX 200 Market Snapshot
- 8 of the 11 sectors advanced, led by XMJ Materials (2.6%), XRE Real Estate (2.2%) and XNJ Industrials (1.6%)
- 156 stocks advanced (78%) with heavyweights such as BHP rising 3%, CBA up 0.9% though it was NAB which led the big four banks higher with its 2.3% gain
- GYG was the best performer, rising 13% to a 9-day high
- Wall Street has provided a positive lead overnight and SPU 200 futures were up 0.4%, hinting at a positive end to the week
Source: ASX, LSEG
ASX 200 Technical Analysis
ASX 200 Cash Index Signals Potential Swing Low
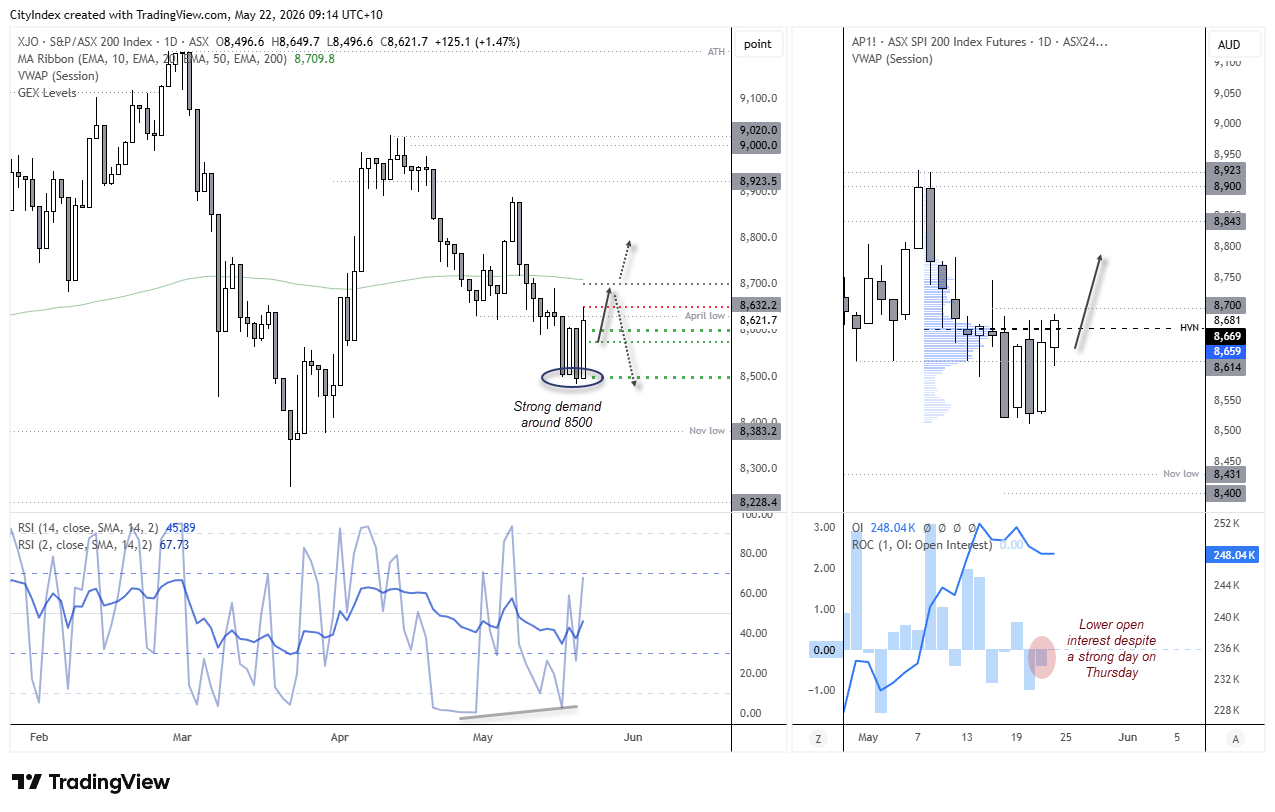
The daily cash market chart (left) shows a prominent bullish engulfing candle, using the 8500 options cluster as a springboard. A bullish divergence has formed on the daily RSI (2) within the oversold zone, further suggesting a swing low could be in place.
Given the positive lead from Wall Street, alongside reduced odds of further RBA hikes, I suspect the ASX 200 could rise further over the coming week — although I’m not expecting a runaway rally. A move towards 8700 could be on the cards, near the 200-day EMA.

SPI 200 Futures Open Interest Suggests Cautious Gains
SPI 200 (ASX 200 futures) shows that open interest has fallen over the past two days, which somewhat undermines the recent rebound. Hence the call for cautious gains. However, with prices back above the high-volume node, dips within Thursday’s range could appeal to bulls seeking a positive end to the week or a stronger start to next week.
Source: ASX, TradingView
ASX 200 Daily, 4-Hour Chart
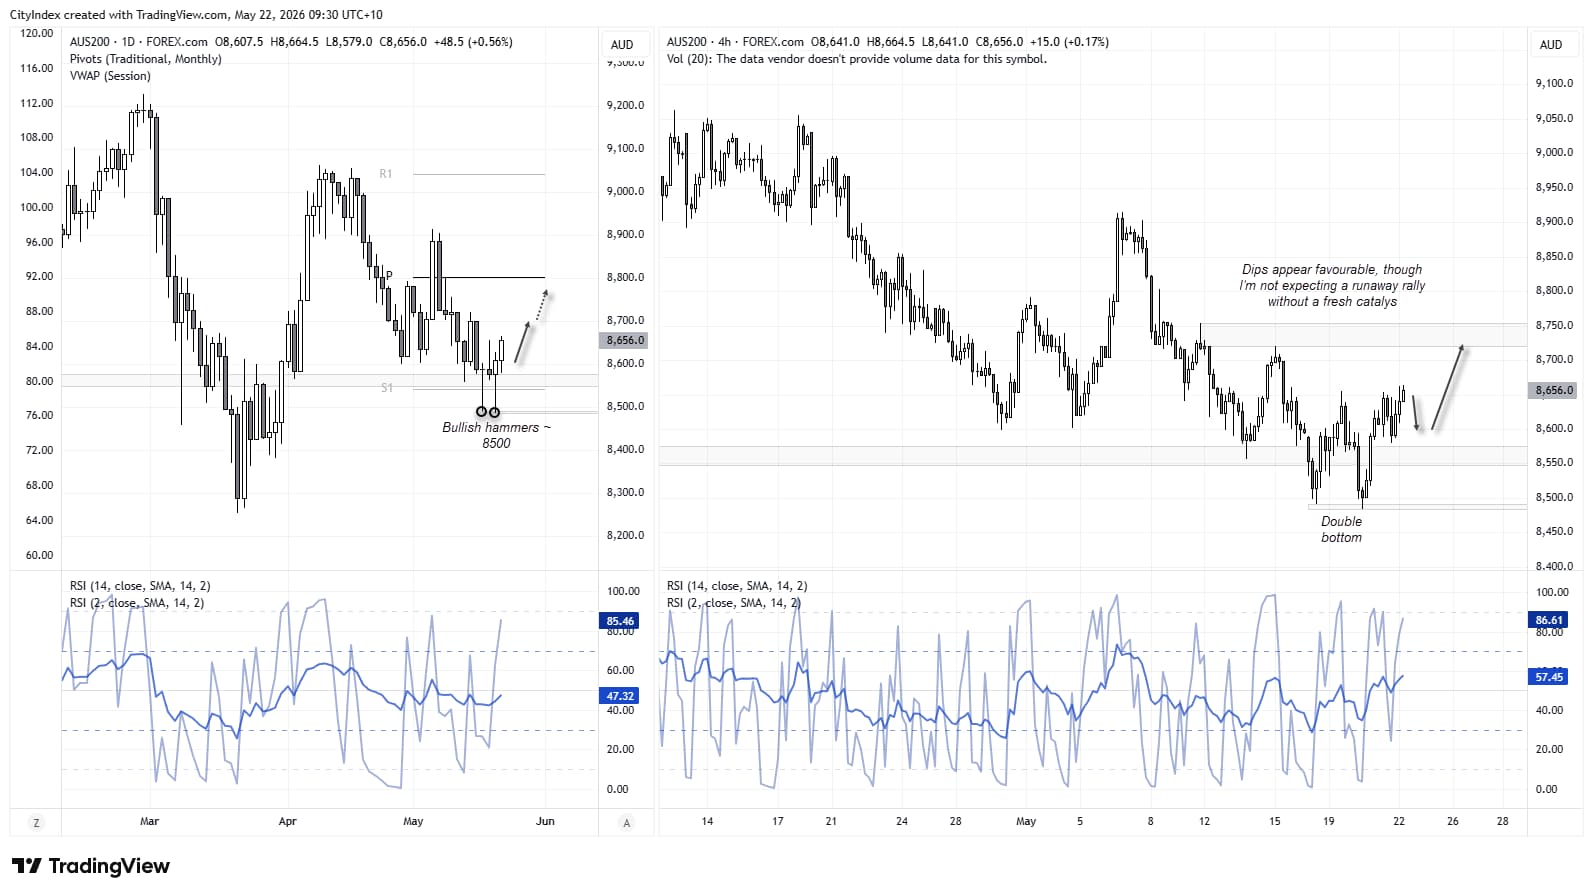
The daily chart shows a double bottom formed around 8500 on the 4-hour chart, which translates to two bullish hammers on the daily timeframe. Both candles marked false breaks of the monthly pivot point before closing back above it and a historical support and resistance zone.
Momentum is now pointing cautiously higher, although I would prefer to see pullbacks towards 8600 before reconsidering longs. Hopefully, a move towards the prior swing highs around 8720 to 8760 is on the cards.
Source: ASX, TradingView
View the full economic calendar
-- Written by Matt Simpson
Follow Matt on Twitter @cLeverEdge
How to trade with City Index
You can trade with City Index by following these four easy steps:
- Open an account, or log in if you’re already a customer
• Open an account in the UK
• Open an account in Australia
• Open an account in Singapore
- Search for the market you want to trade in our award-winning platform
- Choose your position and size, and your stop and limit levels
- Place the trade






