
USD/JPY is showing signs of exhaustion beneath 159 as traders weigh the growing risk of fresh MOF intervention and rising expectations for a hawkish BOJ hike. I look at technical setups across USD/JPY, CAD/JPY and CAD/CHF as yen crosses begin to lose momentum.
View related analysis:
- Crude Oil Outlook: Brent Teases Bears at Elevated Prices
- Japanese Yen Outlook: USD/JPY Risks Reversal as AUD/JPY, CHF/JPY Weaken
- How to Read the COT Report to Track Forex Market Sentiment
- US Dollar Momentum Reverses, Case for Yen Longs Rises | COT Report
USD/JPY Stalls Near 159 as Yen Crosses Lose Momentum
I have been eyeing the rally on USD/JPY with suspicion all week. While the broader US dollar rally has of course been a major factor behind USD/JPY reaching a three-week high, I remain on guard for another round of yen intervention from Japan’s MOF.
We know officials are not comfortable with USD/JPY rising above 160, although it is interesting they allowed it to climb back above 158 — given that was the most recent level of suspected intervention. But the closer price gets to 160, the greater the odds the market may do some of the MOF’s work for them. Otherwise, authorities may feel compelled to step in again should USD/JPY break above 160.
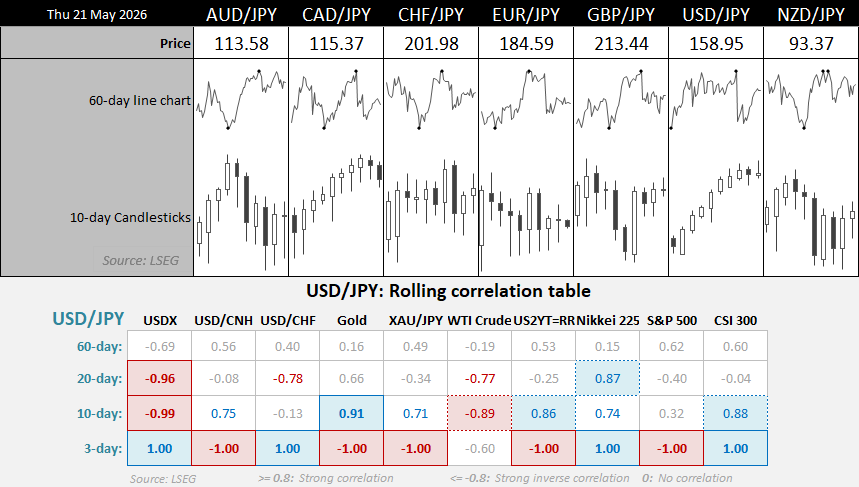
Source: LSEG
JPY Crosses Lose Momentum as USD/JPY Stalls Near 159
JPY crosses are beginning to look stretched near recent highs, with USD/JPY stalling beneath 159 and CHF/JPY, EUR/JPY and GBP/JPY showing increasingly choppy price action. Correlations also show USD/JPY maintaining a strong inverse relationship with the US dollar index and crude oil over shorter timeframes, leaving yen pairs vulnerable should risk sentiment soften further.

USD/JPY Technical Analysis: US Dollar vs Japanese Yen
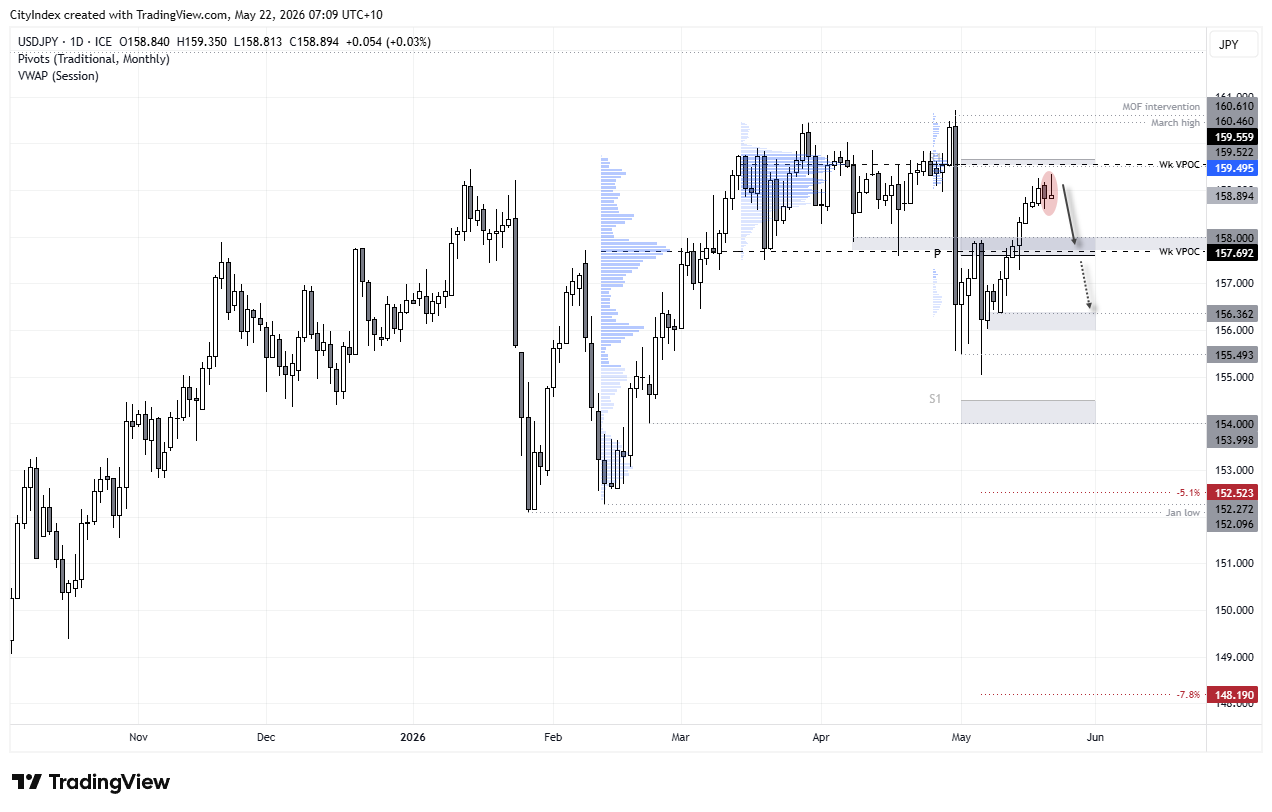
USD/JPY Momentum Stalls Near Key Resistance
The daily chart shows a shooting star candle formed on Thursday, suggesting bullish momentum may be fading around the 159 handle.
A small bearish candle also formed the day prior, snapping a seven-day rally — its best winning streak in nearly two years. A weekly VPOC and the monthly S1 pivot also hover nearby as potential resistance levels, with momentum already beginning to stall.
The fact it has taken 15 days to recoup around three-quarters of the losses sustained during the MOF’s initial intervention is, in my view, a hallmark sign of a corrective move. And that means I am indeed on the lookout for another leg lower, broadly in line with the original selloff from 160.
BOJ Hike Expectations Could Support Yen Strength
And with expectations building for a hawkish Bank of Japan (BOJ) hike in June — while many traders remain short yen futures — perhaps we are getting close to the downside move in USD/JPY that I have been anticipating.
Source: ICE, TradingView

CAD/JPY Technical Analysis: Canadian Dollar vs Japanese Yen
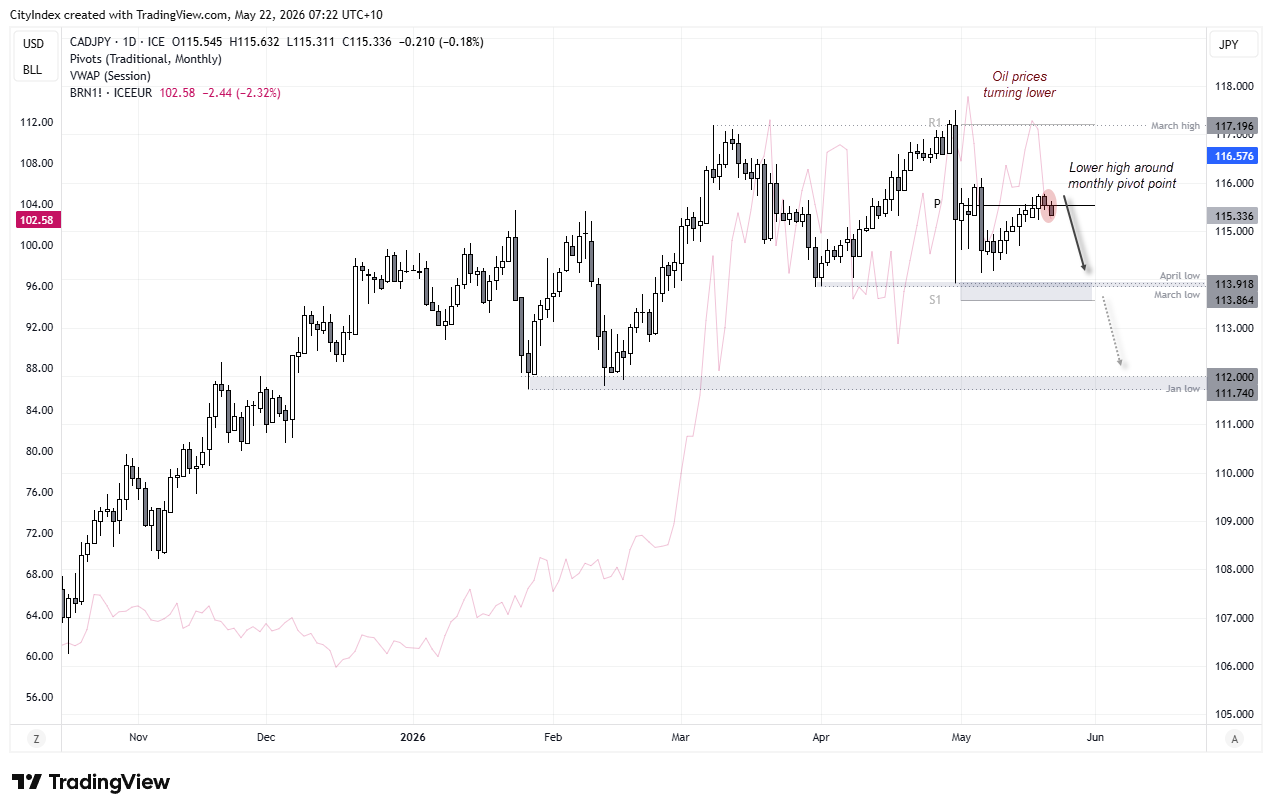
Though far from perfect, the CAD/JPY cross can sometimes correlate well with crude oil prices. And with oil prices easing while the potential for yen strength builds, a potential short setup on CAD/JPY has caught my eye.
The daily chart shows a small bearish inside day formed on Wednesday above the monthly pivot point, before momentum turned slightly lower on Thursday to push prices back beneath the pivot. Perhaps we have already seen the swing high for the week, and bears may be tempted to fade moves towards the pivot (115.54) or the week’s high (115.77) in anticipation of a move back down towards the cycle lows around 114.
The fact this week’s high could also form a compelling lower high relative to the April 30 intervention high brings the potential for a much deeper selloff into focus.
Should the MOF come out swinging, a break beneath the March/April lows or the monthly S1 pivot opens the door for a move towards the 112 handle, near the January low.
Source: ICE, TradingView
CHF/JPY Technical Analysis: Canadian Dollar vs Swiss Franc
I flagged the bearish outside day on CHF/JPY earlier this week and its potential to mark a swing high. While we have since seen two up days, the fact they remain contained within the bearish outside day appears promising for bears.
Bears could seek to fade moves towards Tuesday’s high in anticipation of a break beneath 201 and the monthly pivot point. The 200 handle is an obvious downside target given its big round-number status and the presence of a nearby HVN. Though a move down towards 198 could also come into focus should the MOF spring into action and the BOJ veer towards a hawkish hike.

Source: ICE, TradingView
View the full economic calendar
-- Written by Matt Simpson
Follow Matt on Twitter @cLeverEdge
How to trade with City Index
You can trade with City Index by following these four easy steps:
- Open an account, or log in if you’re already a customer
• Open an account in the UK
• Open an account in Australia
• Open an account in Singapore
- Search for the market you want to trade in our award-winning platform
- Choose your position and size, and your stop and limit levels
- Place the trade