



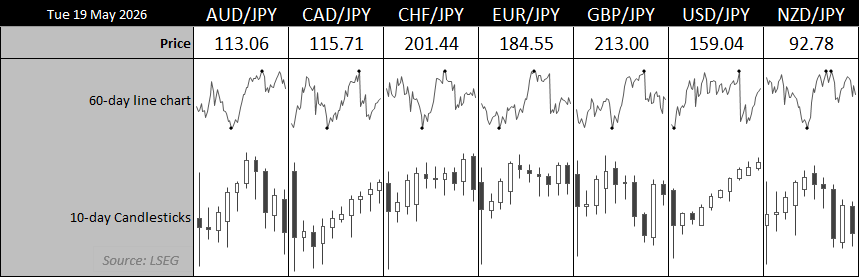
The Japanese yen remains under pressure against the US dollar, but warning signs are beginning to emerge across several key yen crosses. While USD/JPY continues to trade near multi-month highs, the risks of another intervention from Japan’s Ministry of Finance (MOF) are rising. At the same time, AUD/JPY and CHF/JPY are struggling to sustain bullish momentum, increasing the potential for broader yen strength to re-emerge. Here is the latest technical outlook for USD/JPY, AUD/JPY and CHF/JPY.
Source: ICE
View related analysis:
- How to Read the COT Report to Track Forex Market Sentiment
- US Dollar Momentum Reverses, Case for Yen Longs Rises | COT Report
- Australian Dollar Outlook: AUD/USD Pullback Begins as Inflation Risks Rise
- USD Pullback Put on Ice as Bulls Eye 99, AUD/USD Bears Sharpen Their Claws
USD/JPY Technical Analysis: US Dollar vs Japanese Yen
USD/JPY Rally Faces MOF Intervention Risks
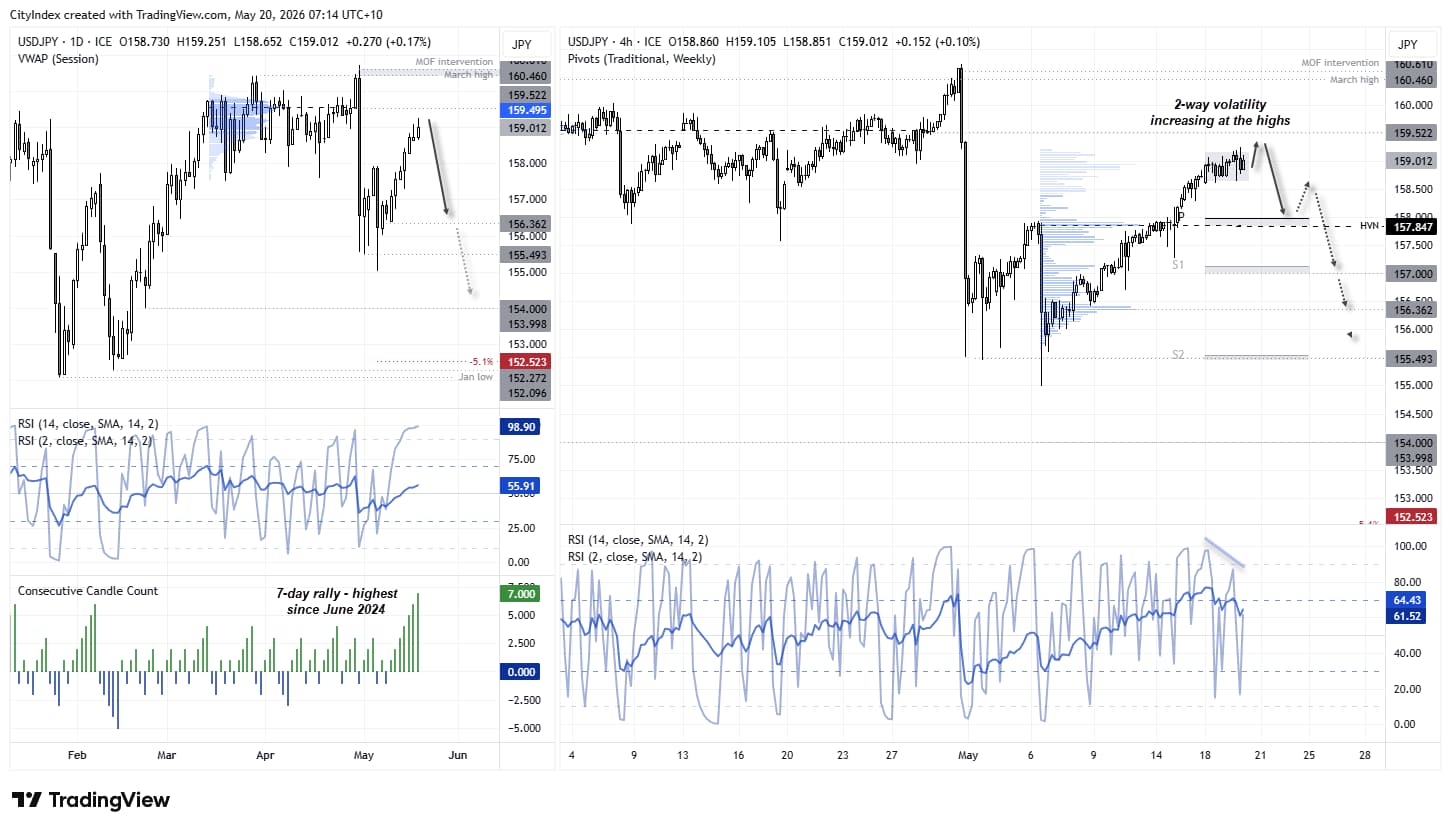
The broader US dollar environment may remain supportive, but I also suspect upside for USD/JPY could be limited due to the rising risk of another MOF intervention. Japanese officials continue to warn markets of further action, having already intervened at least twice since April 30. Therefore, I would not discount the potential for authorities to step in again and send the Japanese yen sharply higher against its peers, to the detriment of USD/JPY despite broader US dollar strength.
USD/JPY closed higher for a seventh consecutive day — its strongest bullish run since June 2024. The daily RSI (2) has also remained stuck in overbought territory for several sessions, which points to limited upside potential or even a pullback in the pair.

USD/JPY 1-Hour Chart Shows Rising Two-Way Volatility
While the 1-hour chart still shows a solid uptrend, two-way volatility has increased around Tuesday’s highs. And with USD/JPY stalling around 159 alongside the nearby 159.52 daily high, bears may be looking to fade rallies from here. With the risk of another MOF intervention lingering, bulls may at least want to trade with caution — though if timed correctly, bears could ultimately get the last laugh.
Note the high-volume node (HVN) just beneath the 158 handle and weekly pivot point, which could provide an interim support zone. A break beneath it brings the 157 handle (near weekly S1) and another volume node around 156.36 into focus.
Source: ICE, TradingView
AUD/JPY Technical Analysis: Australian Dollar vs Japanese Yen
AUD/JPY Daily Chart Signals Potential Reversal
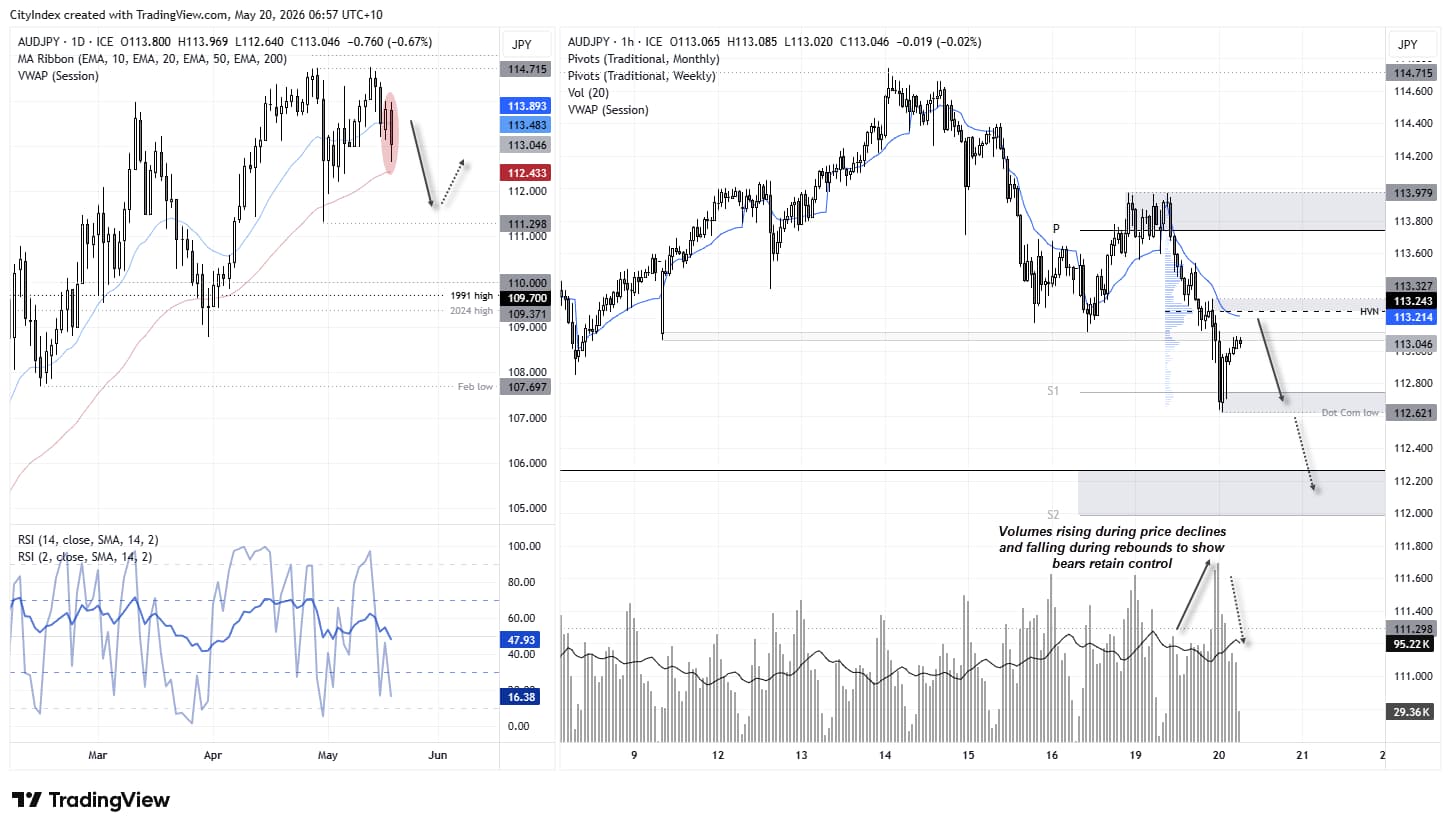
Momentum has been turning against the Australian dollar more broadly, so the fact that AUD/JPY is also struggling to break to fresh highs is quite telling. Tracking several pairs against a single currency can help traders better assess the potential for reversals, and I have flagged several warning signs of a pullback for AUD pairs in recent weeks.
The daily chart shows AUD/JPY only managed a marginal new high last week and also struggled to test 115 before momentum turned lower. Tuesday’s bearish outside day suggests the current leg lower may not yet be complete, bringing the 50-day EMA (112.43), the 112 handle, and the 111.30 low into focus for bears.

AUD/JPY 1-Hour Chart Shows Bears Retain Control
The 1-hour chart shows a bearish trend, although prices are retracing higher. Volumes are rising during declines and falling during bounces, suggesting bears remain in control. Prices also remain beneath the weekly VWAP, which is itself trending lower.
The bias is therefore to fade rallies around resistance zones on the assumption AUD/JPY will break to fresh lows and head towards lower technical levels.
Source: ICE, TradingView
CHF/JPY Technical Analysis: Swiss Franc vs Japanese Yen
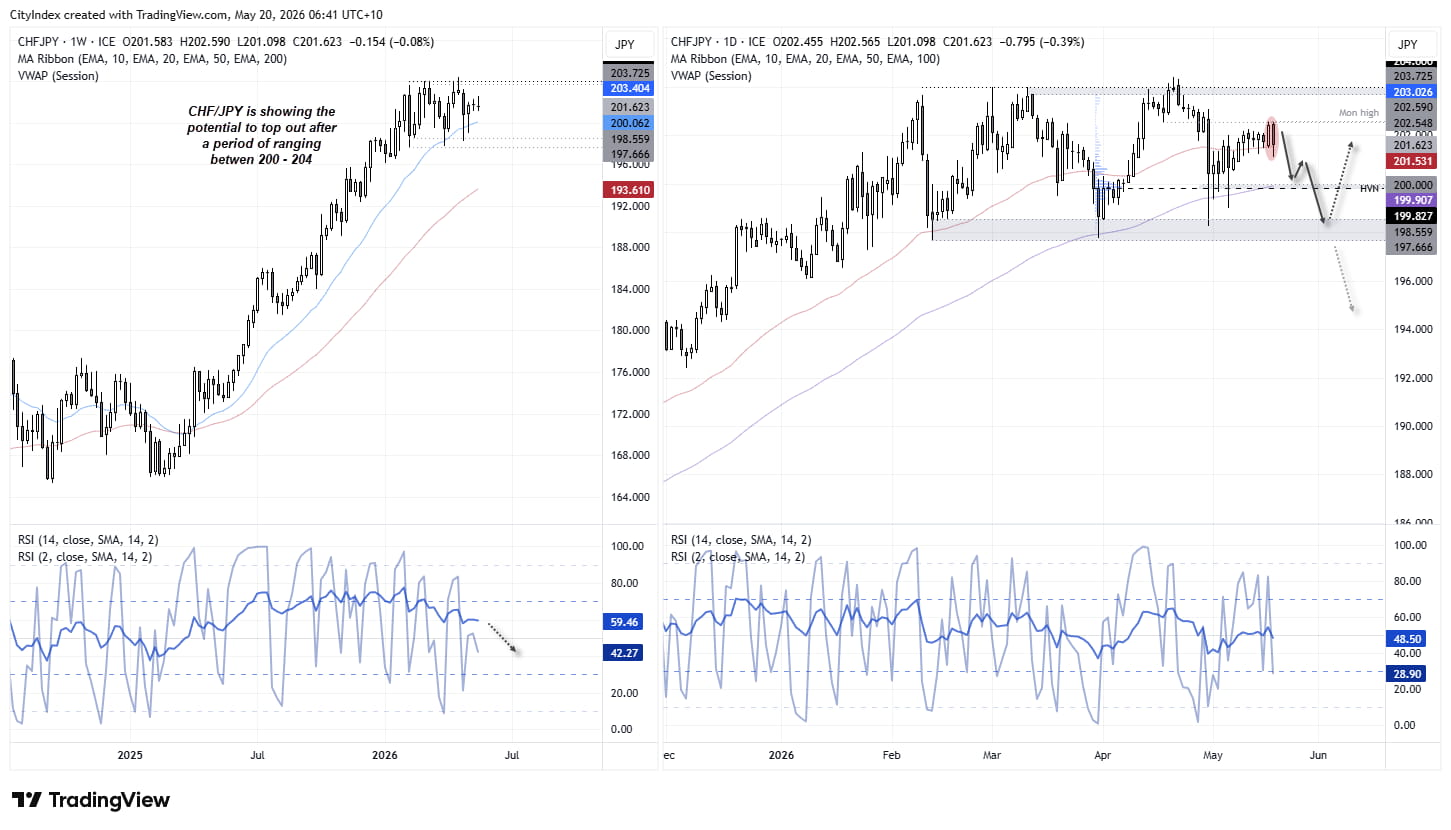
If you zoom out far enough, it becomes clear that CHF/JPY’s broader uptrend began around September 2000. However, its most recent major trough formed in February 2025 — which, by FX market standards, was not that long ago. Since February this year, CHF/JPY has largely traded sideways, with prices mostly contained within the 200–204 range.
For reasons unknown, the Swiss franc has repeatedly struggled to sustain gains above 204. CHF/JPY topped just above this level on April 21, forming a small shooting star before bearish momentum accelerated. Suspected intervention from Japan’s Ministry of Finance (MOF) then slammed prices back toward the lows of the range. More recently, Tuesday’s bearish candle near 202.55 suggests a potential lower high may have formed, which could mark an inflection point and the end of the choppy rebound from the intervention low.
- My bias for CHF/JPY remains bearish while prices remain beneath Monday’s high.
- Bears may look to fade rallies within Tuesday’s range to improve the potential reward-to-risk ratio.
- A break beneath 201 puts the 200 handle into focus, near the high-volume node (HVN) of a prior congestion zone.
Source: ICE, TradingView
View the full economic calendar
-- Written by Matt Simpson
Follow Matt on Twitter @cLeverEdge
How to trade with City Index
You can trade with City Index by following these four easy steps:
- Open an account, or log in if you’re already a customer
• Open an account in the UK
• Open an account in Australia
• Open an account in Singapore
- Search for the market you want to trade in our award-winning platform
- Choose your position and size, and your stop and limit levels
- Place the trade






