


The Australian dollar came under renewed pressure on Friday as rising inflation fears and stronger US economic data reignited demand for the US dollar. Bearish reversal patterns are now emerging across several AUD pairs, while stretched futures positioning and increasingly defensive options pricing suggest the long-awaited AUD/USD pullback may finally be underway.
View related analysis:
- How to Read the COT Report to Track Forex Market Sentiment
- USD Pullback Put on Ice as Bulls Eye 99, AUD/USD Bears Sharpen Their Claws
- US Dollar Rebound Falters, But May Seasonality Remains Supportive
- FX Futures Positioning: USD Index, USD/JPY, USD/CAD | COT Report
- AUD/USD Outlook: Aussie Buoyant Ahead of Trump-Xi Summit
AUD/USD Pullback Gains Momentum as Inflation Risks Support the US Dollar
Inflation Fears and Rising Oil Prices Weigh on the Australian Dollar
Momentum turned sharply lower for the Australian dollar on Friday during risk-off trade, driven by renewed concerns over global inflation. Crude oil prices rallied more than 4% amid expectations of prolonged supply disruptions, while the Trump-Xi summit failed to deliver any tangible trade outcomes or secure Chinese support for US efforts to end the war with Iran.
With US producer prices, retail sales and import prices all surprising to the upside last week, inflationary pressures are intensifying — strengthening the case for US dollar bulls. The US dollar index rallied for a fourth consecutive day and closed back above 99, with bulls now eyeing a break above 99.40 resistance and potentially a move towards 100.
Australian Dollar Sinks as Inflation Fears Boost US Dollar Demand
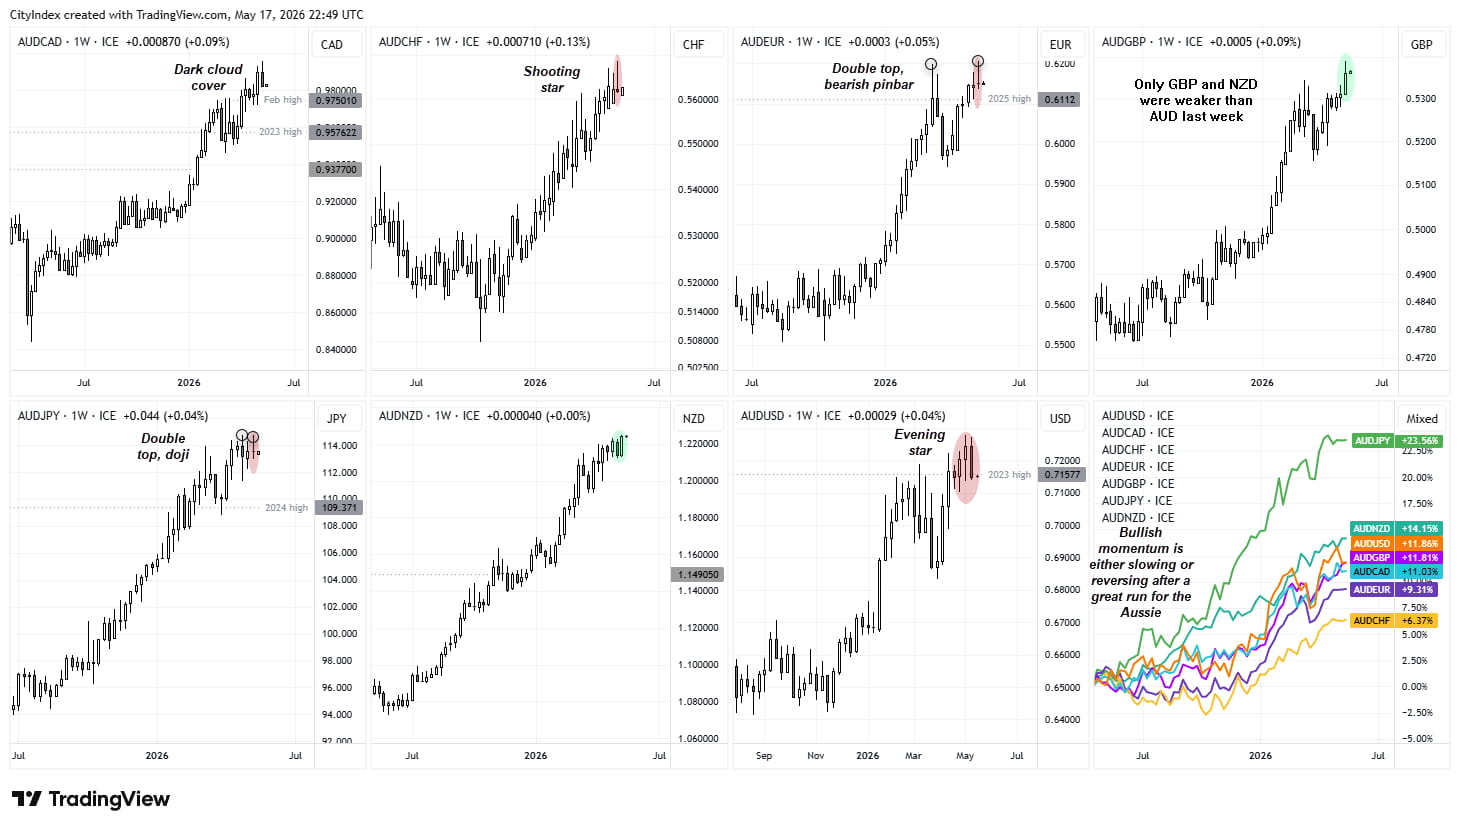
Reversal patterns have formed across several AUD pairs on the weekly and daily timeframes. With risk appetite deteriorating and positioning in the AUD/USD futures market stretched after a strong bullish run, the long-awaited pullback finally appears to be underway.
- AUD/USD: Evening star reversal on the weekly chart, alongside its worst 2-day decline since April
- AUD/CAD: Dark cloud cover bearish reversal on the weekly chart
- AUD/CHF: Shooting star reversal on the weekly chart
- AUD/EUR: Double top near 0.6200 alongside a bearish pinbar on the weekly chart
- AUD/GBP: Bucked the broader bearish trend with its highest weekly close since April 2023
- AUD/JPY: Small bearish pinbar and another failure to close above 114 on the weekly chart
- AUD/NZD: Printed a fresh 13-year high and its strongest weekly gain in six weeks
Source: ICE, tradingView
Australia This Week: Economic Data and Events for AUD/USD Traders
RBA and Fed Minutes Unlikely to Distract from Inflation Risks
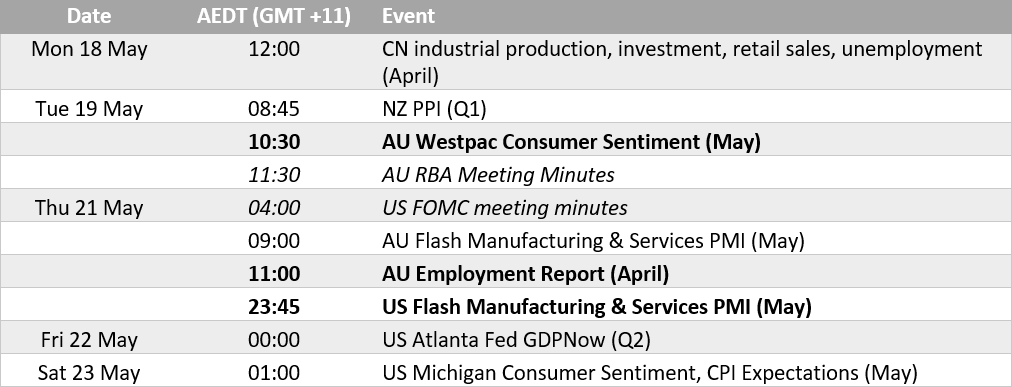
The RBA delivered a hawkish hike, though in reality it was largely catching up with market expectations — and that helped mark a top for the Australian dollar. The RBA minutes released on Tuesday will not reflect the central bank’s views on the government’s latest budget, but there is a strong case that the measures could prove deflationary over the longer term. It is fair to say the budget went down like a lead balloon with many voters, with critics — myself included — viewing it as little more than a CGT-driven cash grab.
I suspect we’re likely to see a softer consumer sentiment report from Westpac in light of the latest rate hike and budget. And if employment data softens — even slightly — it could dent expectations for two further hikes by December, although the RBA are still likely to retain the threat of another 25bp move.
The FOMC minutes will also attract attention, although with Jerome Powell’s term now over and Kevin Warsh at the helm, their market impact may be limited. Besides, crude oil continues to provide the clearest real-time barometer for inflation expectations and the likely direction of Fed policy.
Flash PMIs also seem likely to show a further rise in prices paid — a proxy for inflation trends.

AUD/USD Technical Analysis: Australian Dollar vs US Dollar
AUD/USD Correlations
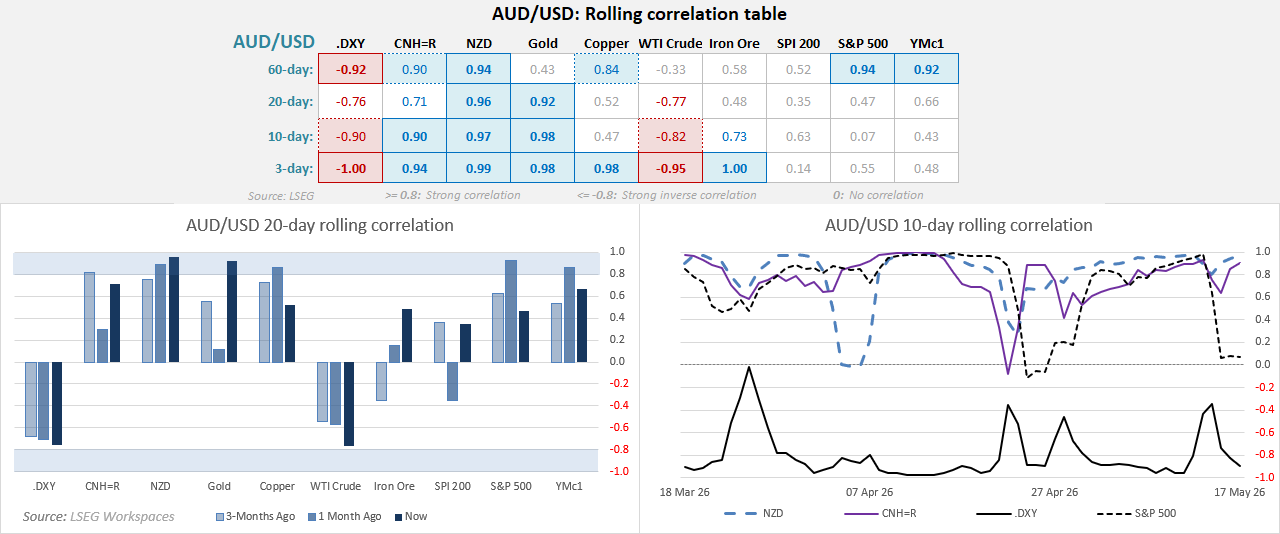
- AUD/USD’s inverse correlation with the US dollar index has strengthened again, sitting at -1.00 over 3 days and -0.90 over 10 days, reinforcing the greenback as the dominant driver of near-term price action.
- Strong positive correlations with NZD, CNH and copper continue to highlight AUD’s sensitivity to China-linked growth and broader risk sentiment.
- Correlations with gold remain elevated, although weaker links to the S&P 500 over shorter timeframes suggest equities are no longer providing the same level of support for the Aussie.
- The sharp negative correlation with WTI crude oil reflects rising inflation fears and oil-driven US dollar demand — a combination that has weighed heavily on AUD during the latest risk-off move.
Source: LSEG
AUD/USD Futures Positioning | COT Report
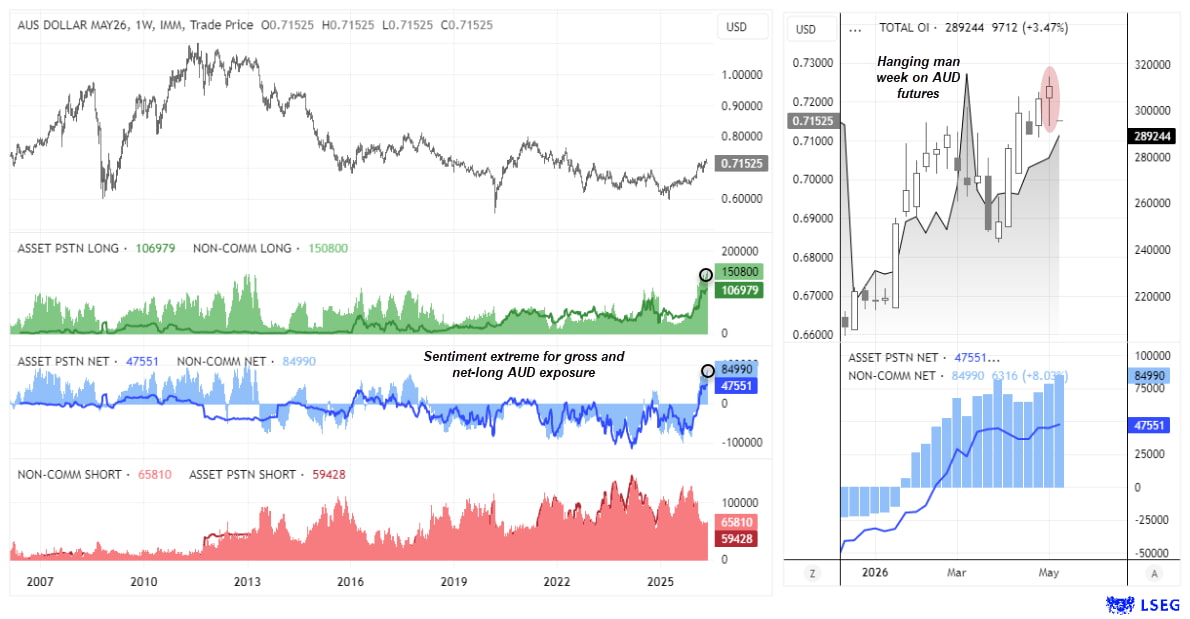
It seems futures positioning had in fact reached a sentiment extreme for AUD/USD bulls in the futures market. Asset managers’ net-long and gross-long exposure have reached record highs several times in recent months, while bullish positioning among large speculators appears no less extreme. With momentum turning lower in spot AUD/USD and a hanging man candle forming on the weekly AUD/USD futures chart, a pullback could now be underway.
Source: CFTC (COT) CME, LSEG

AUD/USD Options and Volatility Analysis (Risk Reversals, HVN Levels)
LSEG pricing for spot AUD/USD shows Friday’s selloff more clearly after the rally failed to reach the May 2022 high on Thursday. Implied volatility also remains relatively low compared with its cycle highs, suggesting volatility may be due to rise again given it tends to oscillate between periods of low and high volatility.
Risk reversals had been supportive of the recent rally, but options traders are now pricing in greater downside tail risk, with the 1-week delta 10 risk reversal (red line) rolling over at an increasingly negative rate. Ultimately, demand for puts outweighed demand for calls over the past week, with downside hedging pressure dragging institutional options pricing lower.
A test — and potentially a break — of 0.7100 could be on the cards this week, although that support level also presents an obvious magnet and potential bounce zone. Bears may now have the 70xx region in focus, which could prove the better litmus test for how deep this pullback may become. For now, I remain open to the idea that 0.7000 could tempt bulls back to the table and allow time for the US dollar rally to lose momentum.
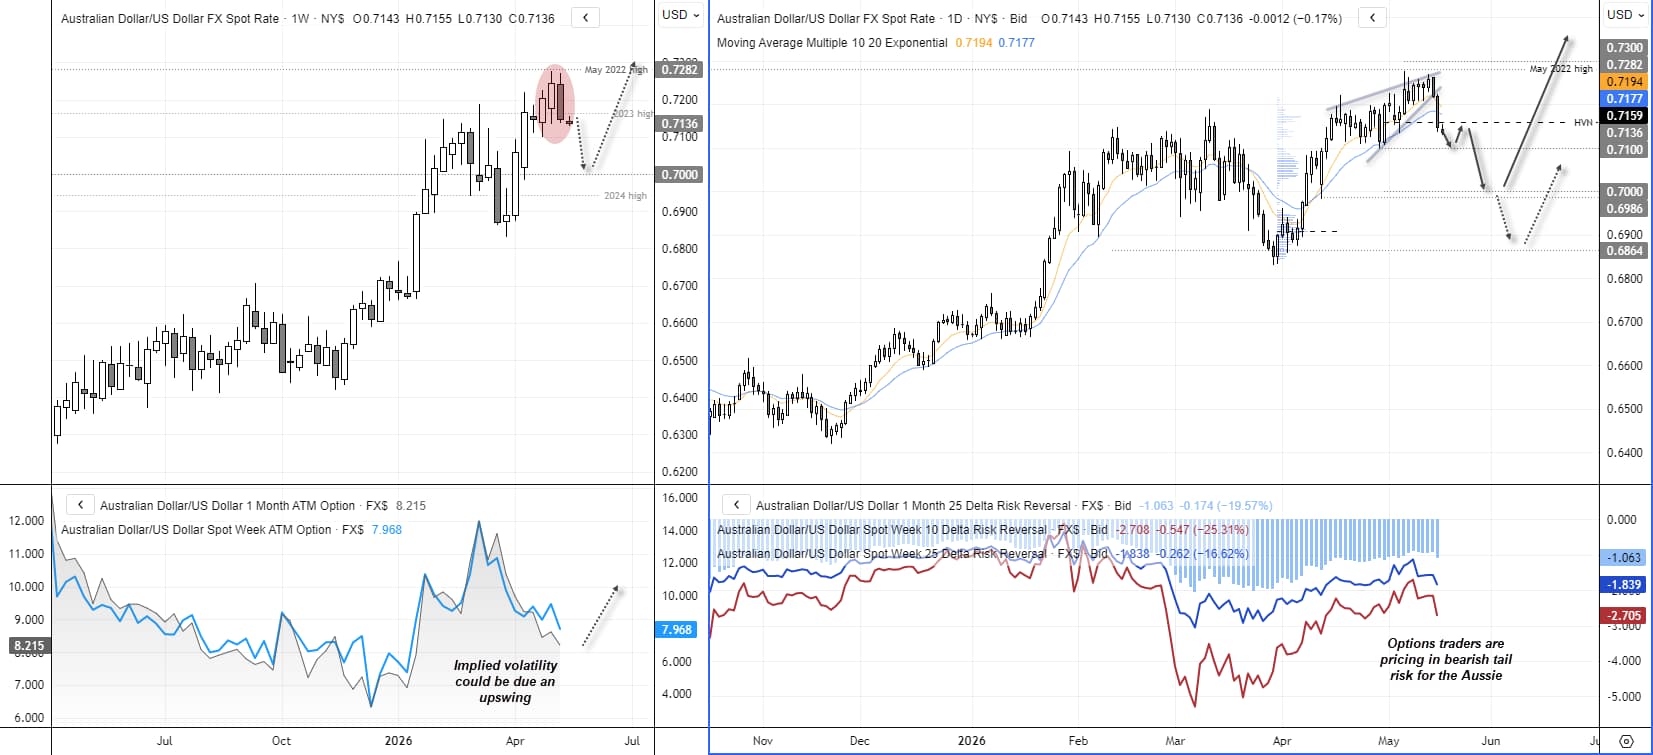
Source: ICE, TradingView
View the full economic calendar
-- Written by Matt Simpson
Follow Matt on Twitter @cLeverEdge
How to trade with City Index
You can trade with City Index by following these four easy steps:
- Open an account, or log in if you’re already a customer
• Open an account in the UK
• Open an account in Australia
• Open an account in Singapore
- Search for the market you want to trade in our award-winning platform
- Choose your position and size, and your stop and limit levels
- Place the trade






