



The US dollar strengthened for a fourth consecutive day as hotter inflation data and fading Fed cut expectations fuelled demand for the greenback. With DXY approaching the key 99 level and traders increasingly pricing the risk of future Fed hikes, the broader bias remains supportive for the US dollar. Meanwhile, AUD/USD is showing signs of fatigue near cycle highs, with a bearish wedge pattern threatening a deeper pullback.
View related analysis:
- How to Read the COT Report to Track Forex Market Sentiment
- Euro Price Action Setups: EUR/USD, EUR/JPY, EUR/NZD
- US Dollar Rebound Falters, But May Seasonality Remains Supportive
- Japanese Yen Outlook: USD/JPY Eyes 158 Pivot, AUD/JPY and GBP/JPY in Focus
- AUD/USD Outlook: Aussie Buoyant Ahead of Trump-Xi Summit
US Dollar Rally Targets 99 as AUD/USD Risks Bearish Breakdown
US Dollar Strengthens on Inflation and Trade Tensions
The US dollar cemented its position as the strongest FX major on Thursday following another round of inflationary data and conflicting headlines from the Trump-Xi summit.
While Xi spoke of a “positive outcome” from trade talks and the potential for China to purchase more US oil, he also warned Trump that relations could head to a “dangerous place” if disagreements over Taiwan are mishandled.
Rising Inflationary Pressures Reignite Fed Hike Bets
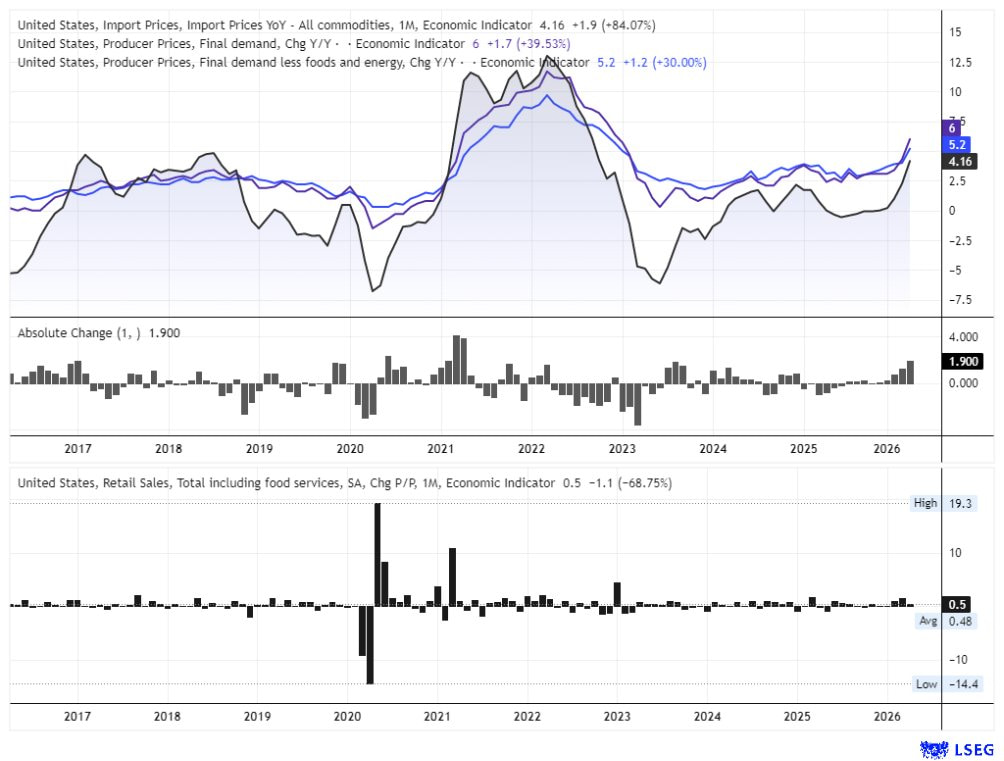
A tax rebate helped lift retail sales by a further 0.5% in April following a 1.7% rise in March, while core retail sales rose 0.7% after a 1.9% increase previously. Import prices rose 4.2% y/y and 0.5% m/m — the fastest annual pace since October 2022. The 1.9 percentage point acceleration also suggests import price momentum has increased for a fifth consecutive month, and at its fastest pace since April 2021.
Keep in mind US producer prices had already packed a punch earlier in the week by rising 6%, while even the ex-energy measure at 5.2% served as a timely reminder that elevated crude oil prices eventually work their way through the supply chain.
Fed funds futures have now effectively killed off any hopes of a Fed cut, with markets instead pricing the odds of a rate hike at nearly 40% by March 2027.
Source: LSEG
US Dollar Index (DXY) Technical Analysis
DXY Rally Extends Towards 99 Resistance
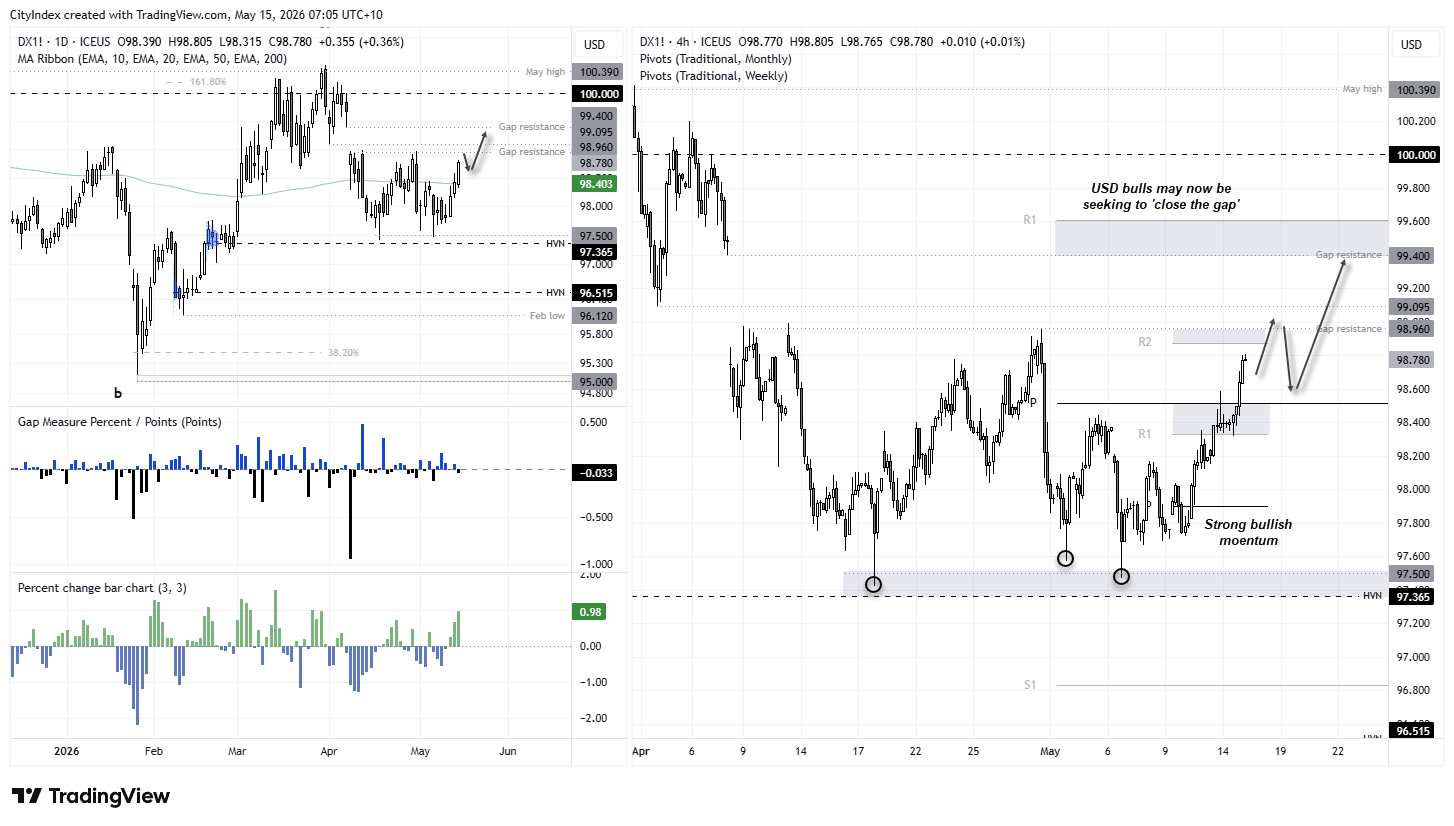
The USD index rose for a fourth consecutive day, with Thursday’s 0.4% gain helping deliver its strongest 3-day rally (+1%) since mid-March. With bullish momentum, supportive economic data and hawkish Fed expectations on its side, the US dollar still appears on track to test my 99 target before the weekend, given it sits less than an average daily range away.
That said, 99 also looks like an obvious area for traders to consider booking profits into the weekend after such a strong run, so bulls should tread with caution around these cycle highs.

USD Bulls Seek to Close The Gap
The bigger question heading into next week is whether bulls can break above the 99.10 swing low. A sustained break could see the rally accelerate into the gap towards 99.40. Also note the monthly R1 pivot near 99.60, which could temporarily cap gains.
Still, with the US-Iran war showing no signs of easing and inflationary pressures supporting expectations for a hawkish Fed, traders may retain a ‘buy the dip’ mentality towards the US dollar for the foreseeable future. Unless, of course, we get headlines suggesting Xi plans to help broker peace talks with Trump. I won’t hold my breath.

Source: ICE, TradingView
AUD/USD Technical Analysis: Australian Dollar vs US Dollar
AUD/USD Rising Wedge Pattern Nears Potential Breakdown
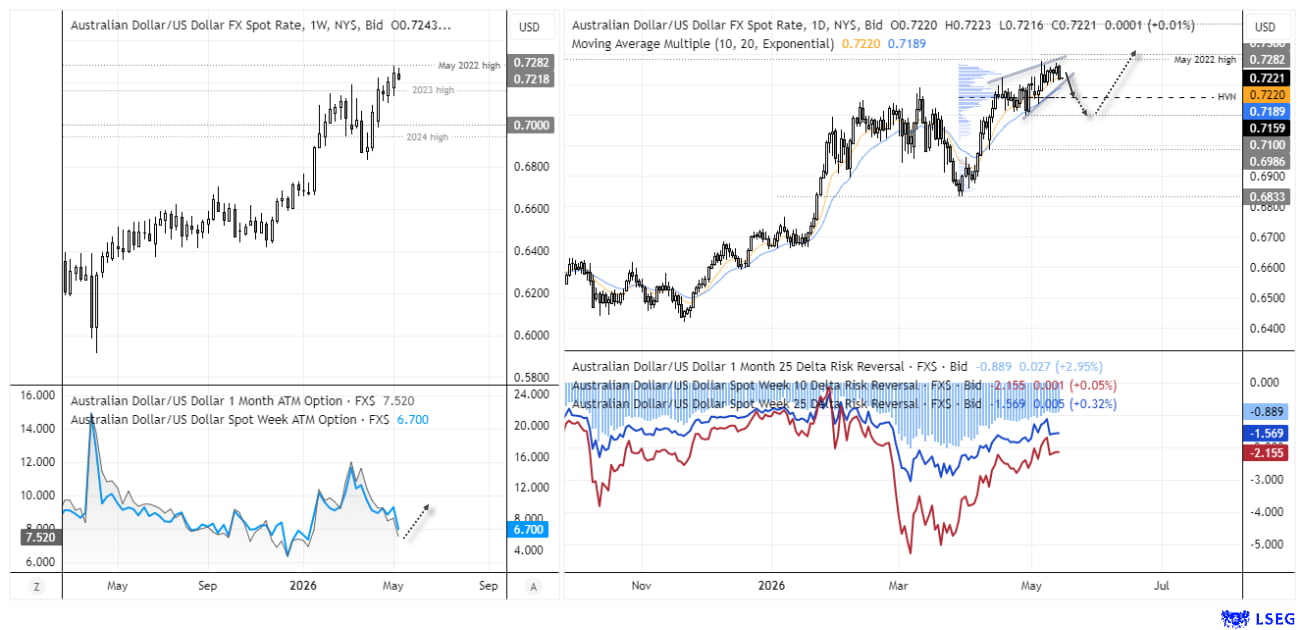
Price action on the Aussie dollar’s daily chart is becoming increasingly interesting. I have highlighted the potential rising wedge pattern in prior articles, and yesterday’s bearish engulfing candle suggests the top may already be in place.
While AUD/USD has enjoyed an undeniably strong run since last April’s low, bulls have struggled to make material gains over the past month, with choppy price action paving the way for a potential reversal pattern. Note that implied volatility also remains relatively low from its peak — and given volatility is cyclical while the Australian dollar sits near cycle highs, perhaps it is time for a shake-up after all.

AUD/USD Bearish Targets Come into Focus
If successful, the rising wedge pattern projects a bearish target near its base just above 0.71. For now, bears may seek to fade moves within Thursday’s range and retain a bearish bias while prices remain below cycle highs. Note the high-volume node (HVN) at 0.7221, which could provide a near-term bearish target. A break beneath there brings the next leg lower towards 71c into focus.
Note that risk reversals are not yet leading the move lower to show a relative increase in put demand over calls. I therefore prefer the more cautious target around 0.7220, although risk reversals could quickly move lower should bearish momentum on AUD/USD accelerate.
Source: ICE, TradingView
View the full economic calendar
-- Written by Matt Simpson
Follow Matt on Twitter @cLeverEdge
How to trade with City Index
You can trade with City Index by following these four easy steps:
- Open an account, or log in if you’re already a customer
• Open an account in the UK
• Open an account in Australia
• Open an account in Singapore
- Search for the market you want to trade in our award-winning platform
- Choose your position and size, and your stop and limit levels
- Place the trade






