The euro is showing mixed technical signals across major crosses, with EUR/USD threatening another leg lower as US dollar correlations strengthen, EUR/JPY attempting to recover from suspected MOF intervention losses, and EUR/NZD consolidating beneath key resistance within a broader downtrend. While near-term rebounds remain possible across several pairs, broader price action still favours selective bearish setups against the euro in the sessions ahead.
View related analysis:
- US Dollar Rebound Falters, But May Seasonality Remains Supportive
- Japanese Yen Outlook: USD/JPY Eyes 158 Pivot, AUD/JPY and GBP/JPY in Focus
- VIX Breakout Flashes Warning Signal for Wall Street
- FX Futures Positioning: USD Index, USD/JPY, USD/CAD | COT Report
Euro Technical Outlook: EUR/USD, EUR/JPY and EUR/NZD Setups in Focus
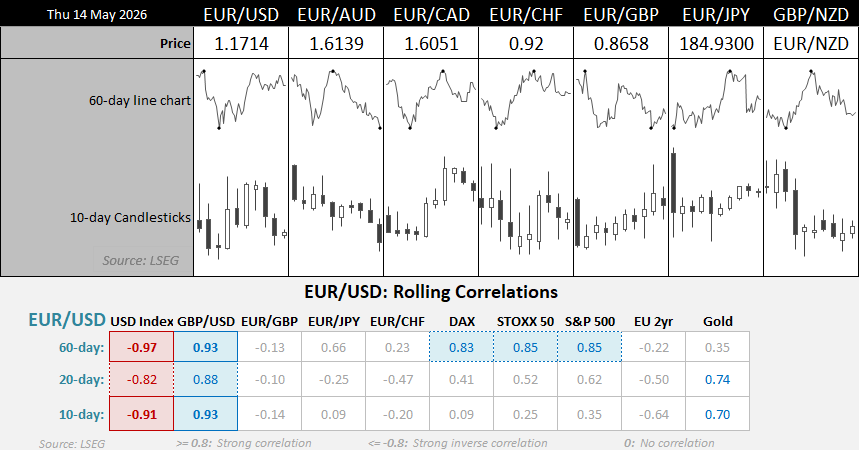
EUR/USD Correlations Show US Dollar Influence Reasserting Itself
- EUR/USD’s inverse correlation with the US dollar index has strengthened back towards its more typical levels, reaching -0.82 over 20 days and -0.91 over 10 days after softening slightly on the 60-day view.
- Strong positive correlations with GBP/USD and European equity indices such as the DAX and STOXX 50 continue to reinforce EUR/USD’s sensitivity to broader risk sentiment and macro expectations.
- Gold correlations have also firmed over shorter timeframes, suggesting inflation and macro themes are again becoming more influential for FX flows.
- Meanwhile, correlations with EUR/GBP and EUR/CHF remain relatively weak, implying the US dollar side of the equation is once again becoming the dominant driver for EUR/USD direction.

Source: LSEG

EUR/USD Technical Analysis: Euro vs US Dollar
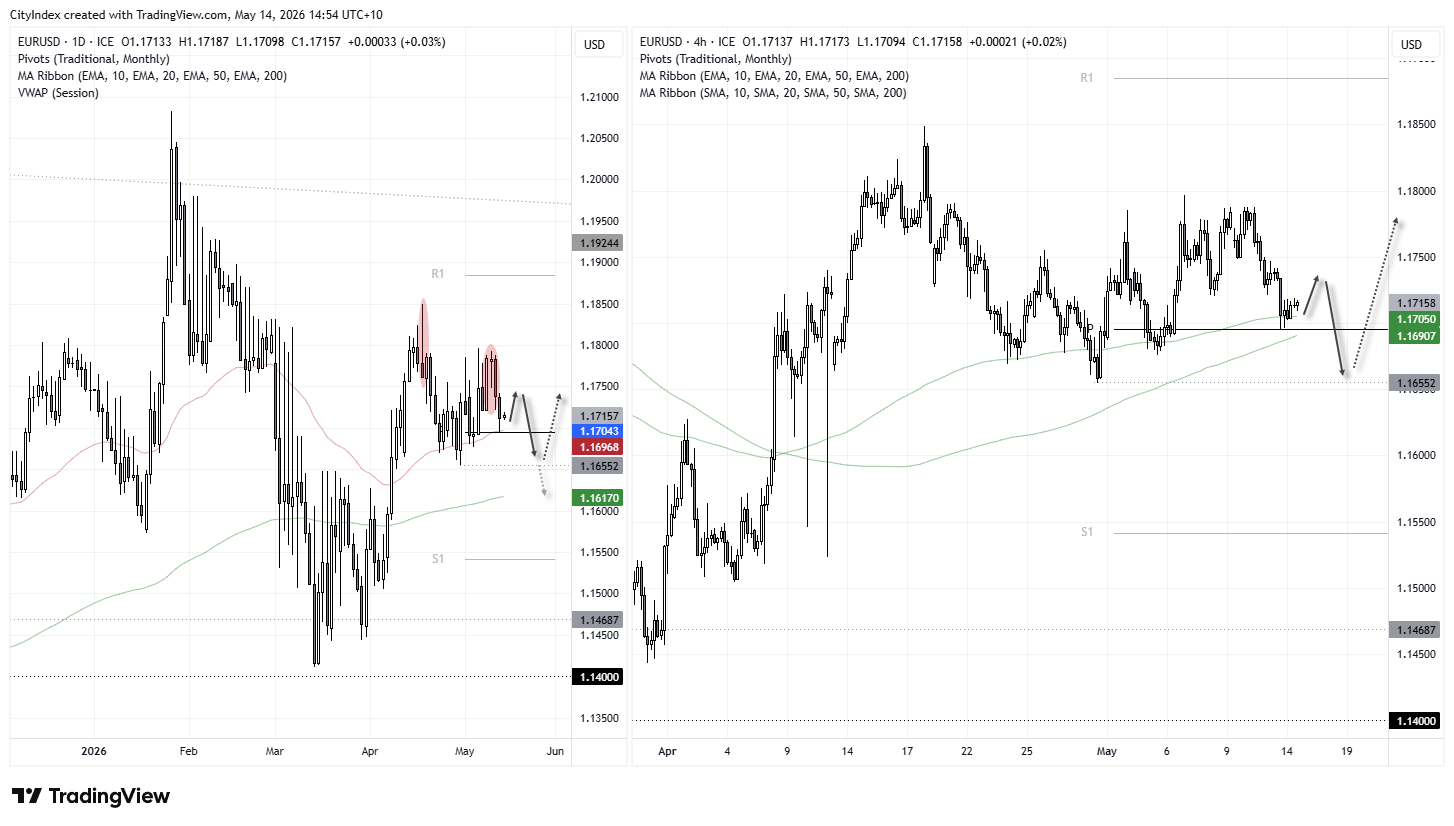
From a pure price action perspective, it appears EUR/USD may be building towards another leg lower. A prominent shooting star formed on April 17, followed by a lower high below 1.18 — including a 3-bar bearish reversal pattern known as a dark cloud cover. Furthermore, momentum appears to be turning lower from within a rough rising channel, which itself could be interpreted as corrective against the prior decline.
If the euro is preparing to roll over, that implies a much stronger US dollar — and my earlier estimate of a rally towards 99 may even prove understated. As always, time will tell.
However, the near term could still see EUR/USD bounce while the US dollar index retraces lower. Wednesday’s low found support at the 50-day EMA (1.1697) and the monthly pivot point near the 1.17 handle. If prices bounce, it could provide bears with a better entry somewhere within Wednesday’s range.
A break below 1.17 brings the 1.1655 low into focus, ahead of the 200-day EMA just above the 1.16 handle.
Source: ICE TradingView
EUR/JPY Technical Analysis: Euro vs Japanese Yen
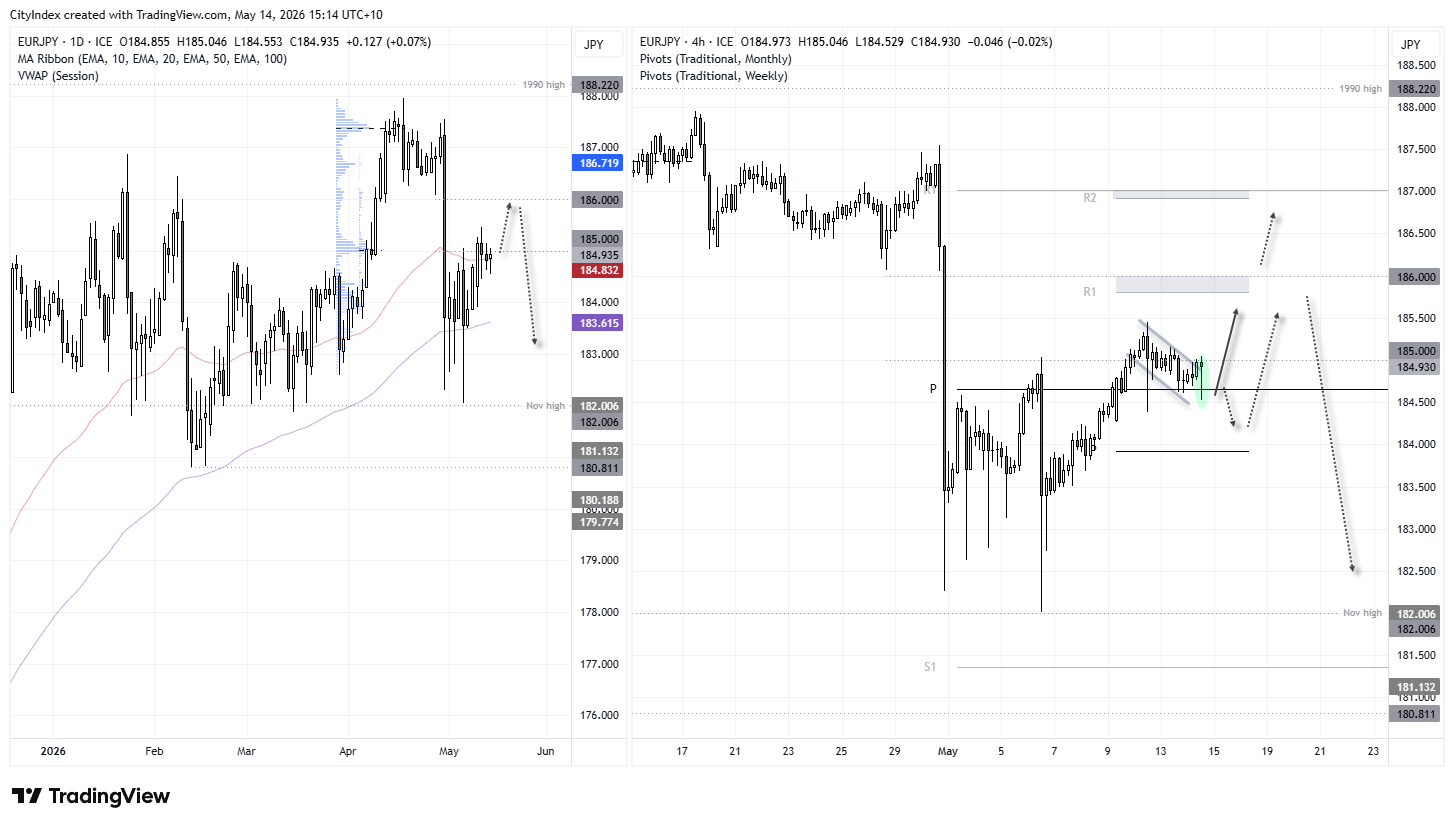
It has been 10 trading days since Japan’s Ministry of Finance (MOF) is strongly suspected to have intervened in the currency market, sending the yen sharply higher. EUR/JPY fell more than 500 pips on the day, although it took four days to print a cycle low just above 182. The cross has since recouped around half of those losses, which has allowed the 1-hour chart to develop a decent uptrend.
I’m not yet convinced the trend will fully reverse the intervention-led losses, but the structure is constructive enough to hint at least one more leg higher.
The 1-hour chart shows prices have pulled back to the monthly pivot point and are on track to form a bullish hammer. The mild retracement from Tuesday’s high also suggests EUR/JPY is trying to build energy for another burst higher.
Ultimately, dips are favoured while volatility remains low, with EUR/JPY potentially heading towards 186 over the near term. Whether it can continue higher likely depends on the MOF and whether they feel the need to intervene again for what could be a third time.
Source: ICE TradingView

EUR/NZD Technical Analysis: Euro vs New Zealand Dollar
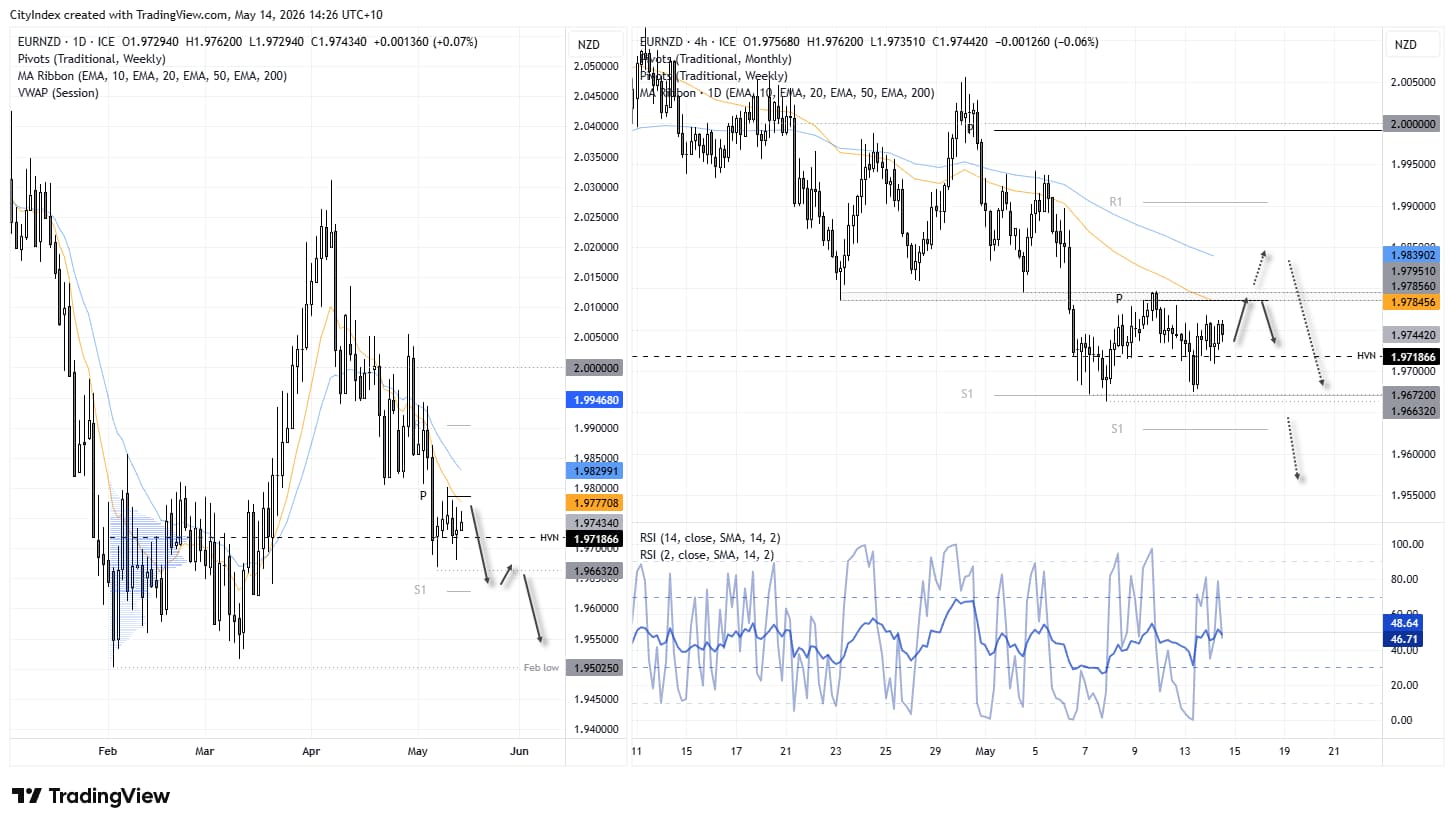
The euro has been within an established downtrend on the daily chart since April, with a prominent lower high forming around 2.0 at the beginning of May. Yet prices have since entered a sideways consolidation, which has interestingly seen the open and closing prices respect the high-volume node (HVN) from the February–March consolidation phase. Recent lows have also formed around the monthly R1 pivot point.
And with Wednesday’s doji forming a higher low, perhaps momentum can temporarily turn higher. But unless bulls can truly regain control, I suspect EUR/NZD could be headed back towards the February low.
For now, bears can either wait for evidence of a swing high around resistance — whether it be the 10-day EMA, 20-day EMA, or weekly pivot point.
Source: ICE TradingView
View the full economic calendar
-- Written by Matt Simpson
Follow Matt on Twitter @cLeverEdge
How to trade with City Index
You can trade with City Index by following these four easy steps:
- Open an account, or log in if you’re already a customer
• Open an account in the UK
• Open an account in Australia
• Open an account in Singapore
- Search for the market you want to trade in our award-winning platform
- Choose your position and size, and your stop and limit levels
- Place the trade