Wall Street indices continue to rally with barely a pause, but the VIX is beginning to show early signs that sentiment may be shifting. While it is far too early to call a top in US equities, rising volatility expectations, stretched momentum indicators, and growing demand for VIX hedges suggest traders should at least approach the rally with greater caution. And if a reversal does emerge, the Dow Jones may offer the cleanest bearish setup of the major US indices.
View related analysis:
- How to Read the COT Report to Track Forex Market Sentiment
- US Dollar Coiling, USD/JPY Eyes Resistance Heading into US CPI
- FX Futures Positioning: USD Index, USD/JPY, USD/CAD | COT Report
- AUD/USD Outlook: Aussie Buoyant Ahead of Trump-Xi Summit
- ASX 200 Outlook: Range Trade Persists as Financials and Materials Stabilise
VIX Warning Signals Emerge for Wall Street Indices
VIX Breakout Warning Flashes for US Indices
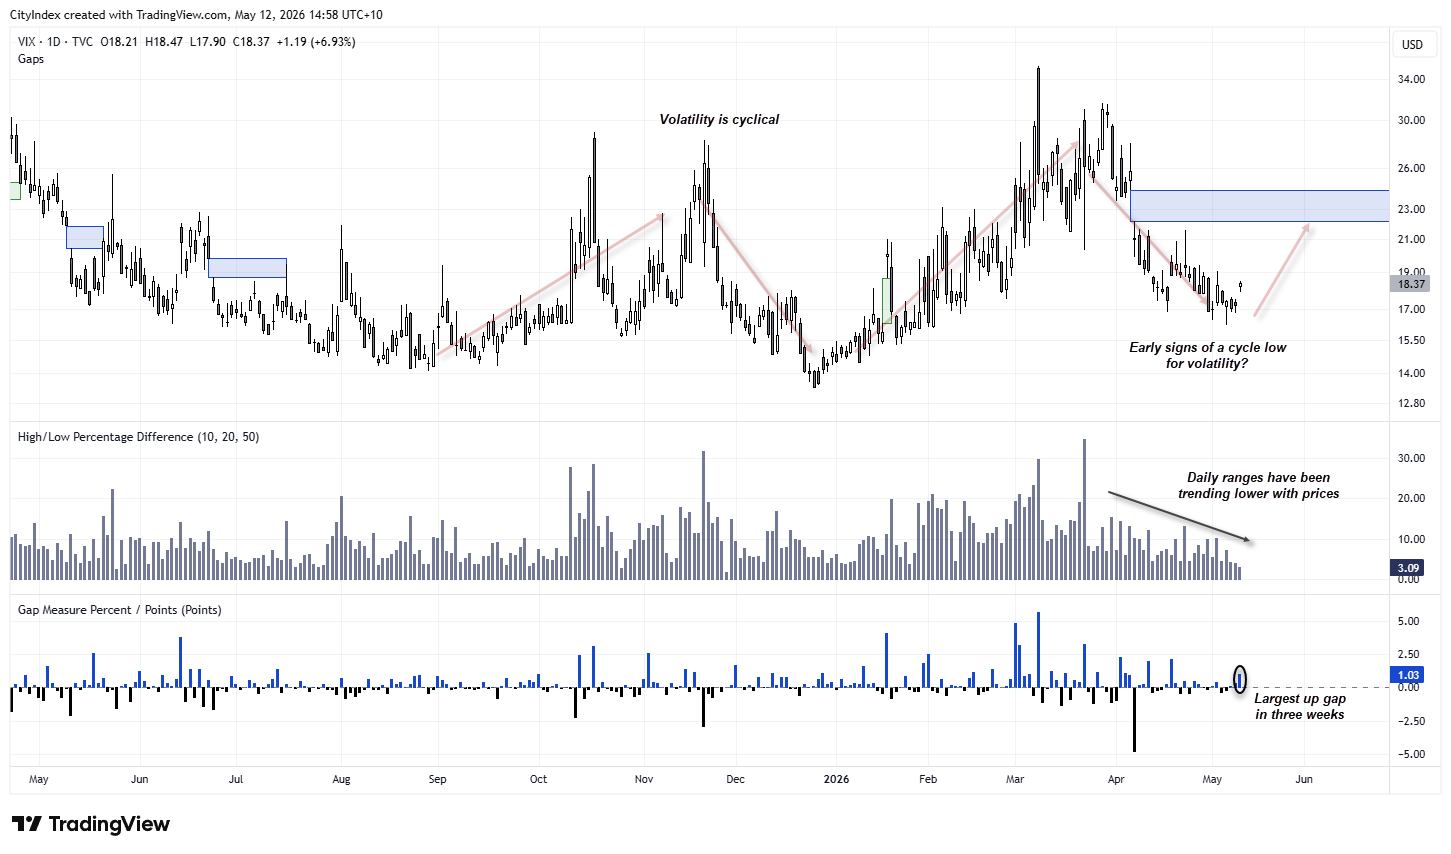
The spot volatility index (VIX) caught my eye today after gapping higher on Monday. While the one-point gap itself is not excessive, the fact it appeared following a consolidation phase just above 16 adds weight to the move in my view. Also note the two lower wicks ahead of the prior two days’ coiling price action, which further raises the risk of a shift in sentiment. Daily high-to-low ranges have also been trending lower since the March high. Add in the fact that volatility — and therefore the VIX — is cyclical and has been trending lower for the past two months, and the case for a pickup in volatility may be building. And if the VIX continues to rise, it usually spells trouble for Wall Street indices.
Source: TradingView

Volatility Index (VIX) Futures Positioning | COT Report
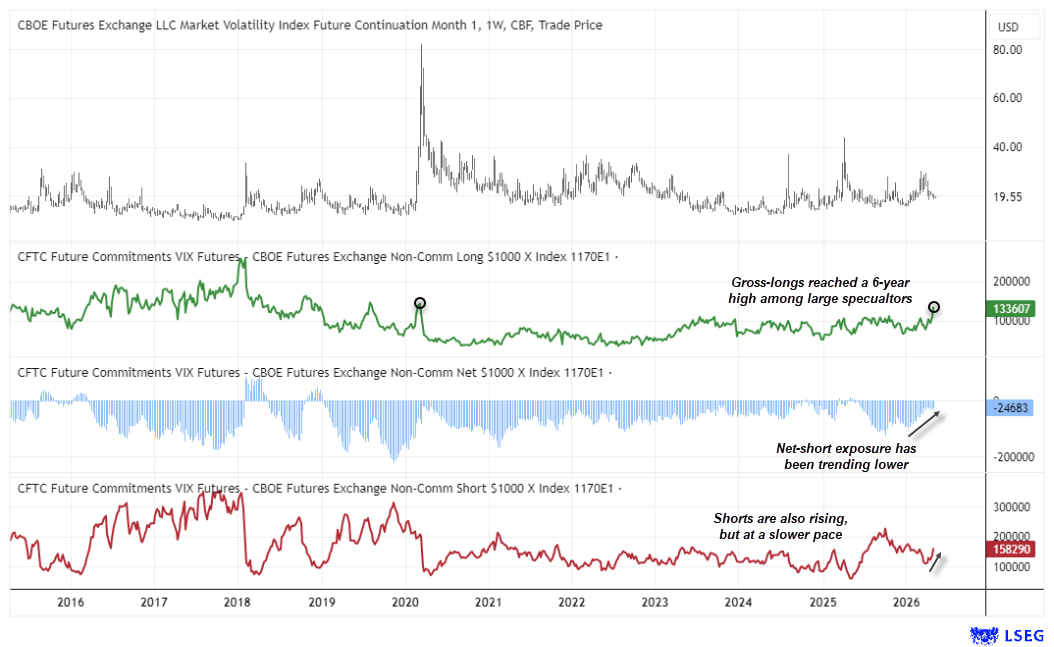
The weekly VIX futures chart highlights the cyclical nature of volatility and its tendency to eventually spike higher. Whether today’s US inflation report proves to be the catalyst remains to be seen. And the threat does not necessarily have to be immediate, as volatility troughs can take time to fully develop. However, when volatility does break higher, it tends to coincide with a more meaningful bout of risk-off sentiment.
Net-short exposure to VIX futures has been trending lower, suggesting less appetite among speculators to bet on subdued volatility. Gross-long exposure has also risen notably in recent weeks, with bullish bets climbing to their highest level since March 2020 at 133.6k contracts.
Source: CME, LSEG
Nasdaq and S&P 500 Extend Rally, but Dow Jones Looks Fragile
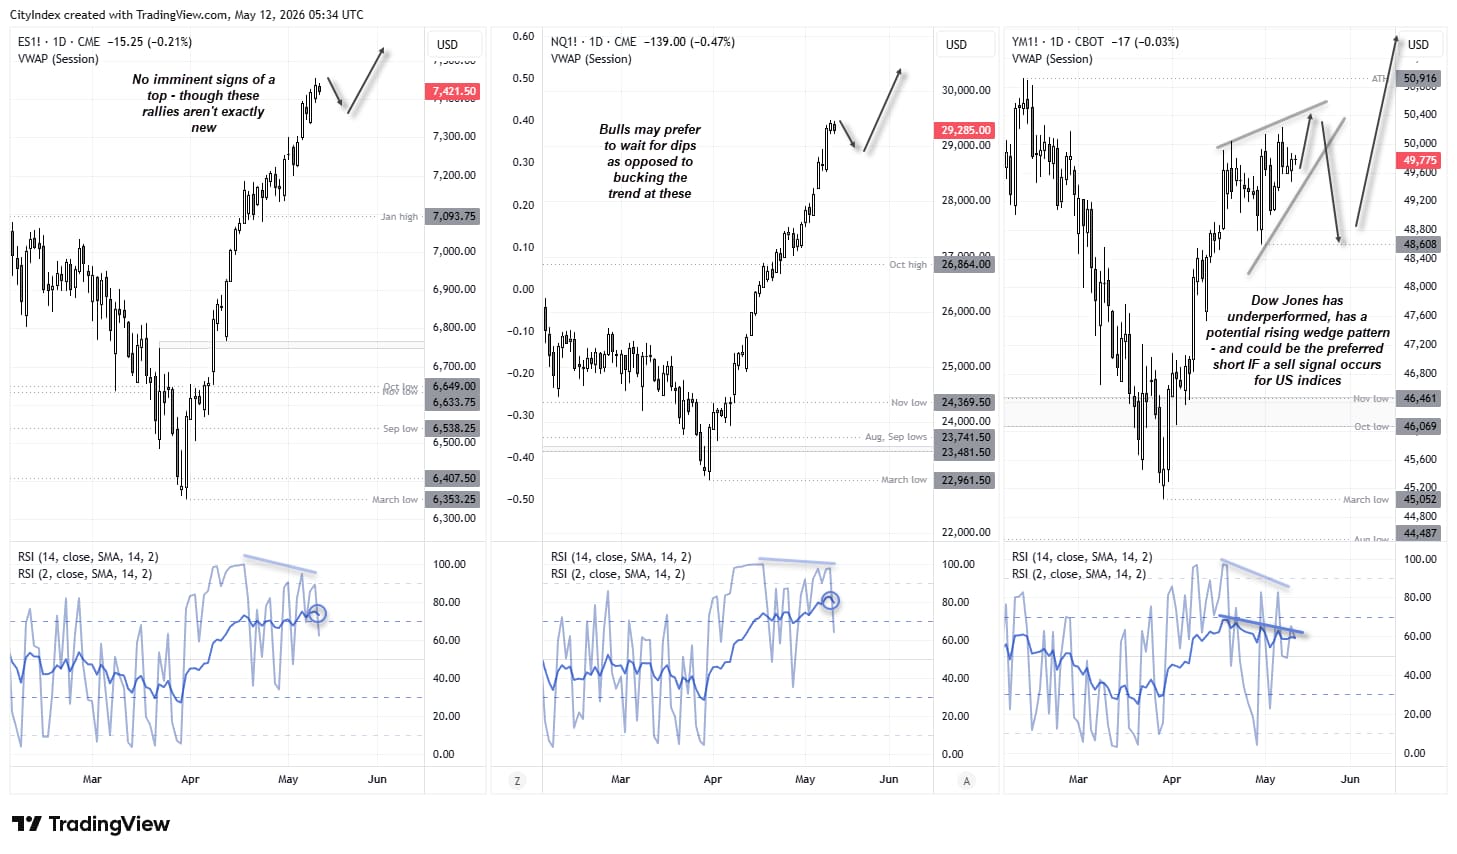
To say US indices have rallied strongly from their March lows would be an understatement. Nasdaq 100 futures have led the charge with a 28.4% gain, while the S&P 500 follows with a 17.3% rise. Neither market has experienced much of a pullback, with prices effectively rising in a straight line. And with no obvious signs of a top just yet, it would be a gamble to short such momentum purely because the VIX has gapped higher.
Still, the signal from the VIX should at least encourage Wall Street bulls to view the rally with greater scrutiny. Bearish divergences have formed on the RSI (2) within overbought territory, while the RSI (14) is also overbought at the time of writing.

Dow Jones Looks Most Vulnerable if Wall Street Turns Lower
But if a sell signal were to emerge on US indices, the Dow Jones would be my preferred vehicle. The Dow has risen just 11.5% from its March low, and price action since mid-April has been choppy enough for a potential rising wedge — a bearish reversal pattern — to form. If confirmed, the wedge projects a downside target towards its cycle low of 38,608.
Source: CME, CBOT, TradingView
View the full economic calendar
-- Written by Matt Simpson
Follow Matt on Twitter @cLeverEdge
How to trade with City Index
You can trade with City Index by following these four easy steps:
- Open an account, or log in if you’re already a customer
• Open an account in the UK
• Open an account in Australia
• Open an account in Singapore
- Search for the market you want to trade in our award-winning platform
- Choose your position and size, and your stop and limit levels
- Place the trade