
The ASX 200 is attempting to stabilise after a multi-week pullback, with price holding near key support levels as financials and materials begin to show early signs of basing. While correlations are strengthening and broader participation is improving, upside remains capped near 8700 for now.
With implied volatility still low and options positioning pointing to a balanced market, traders may need to brace for continued range-bound conditions before any sustained move higher towards 8750–8800 can unfold.
View related analysis:
- Japanese Yen Weakens: USD/JPY Rebounds as EUR/JPY and AUD/JPY Diverge
- AUD/USD Outlook: RBA Hike Priced In as Yields Ease, Momentum Fades
- ASX 200 Outlook: 8700 Battleground as Bears Maintain Control
- ASX 200 Outlook: CSL, COH, Drag Healthcare and ASX Lower
ASX 200 Range Trade Holds as Financials and Materials Stabilise
ASX 200 Market Snapshot
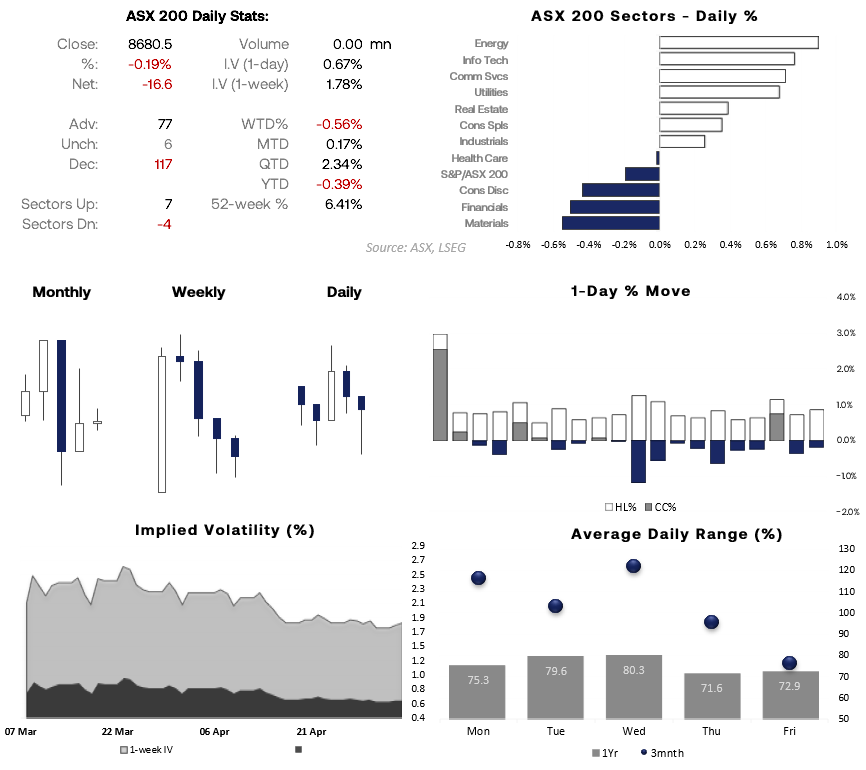
- The ASX 200 cash index printed a bullish hammer on Tuesday, with SPI 200 futures pointing to a higher open
- The index has declined for three consecutive weeks and is attempting a fourth lower close, suggesting a potential near-term inflection point
- Wednesday shows the highest average daily range over the past 3 months (121.8 points) and 1-year (80.3 points)
- Implied volatility remains low but is starting to curl higher, at 0.6% (1-day) and 0.8% (1-week)
Source: ASX, LSEG
ASX 200 Correlations: Financials and Materials Regain Control
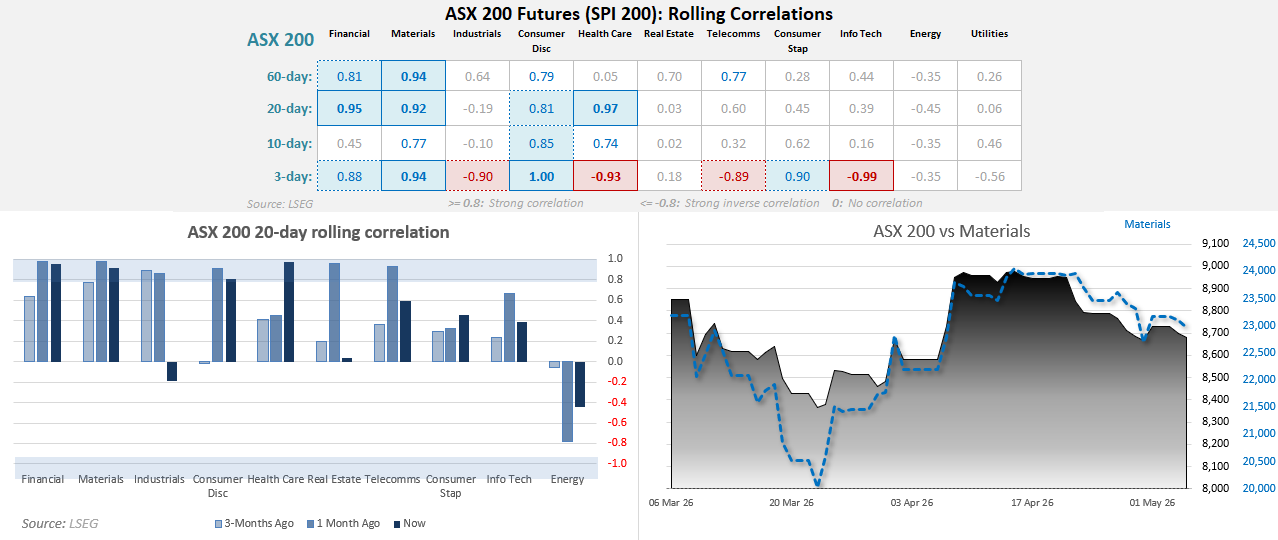
Financials and materials briefly lost influence, but correlations are snapping back. The 3-day is back near 0.9 for both, the 10-day is rebuilding (0.77), and the 20- and 60-day remain firmly strong—these are still the primary drivers.
Elsewhere, consumer discretionary and healthcare are stepping up, showing tighter alignment with the index and pointing to broader participation.
Source: ASX, LSEG

ASX 200 Sectors: Financials and Materials Eye Potential Base
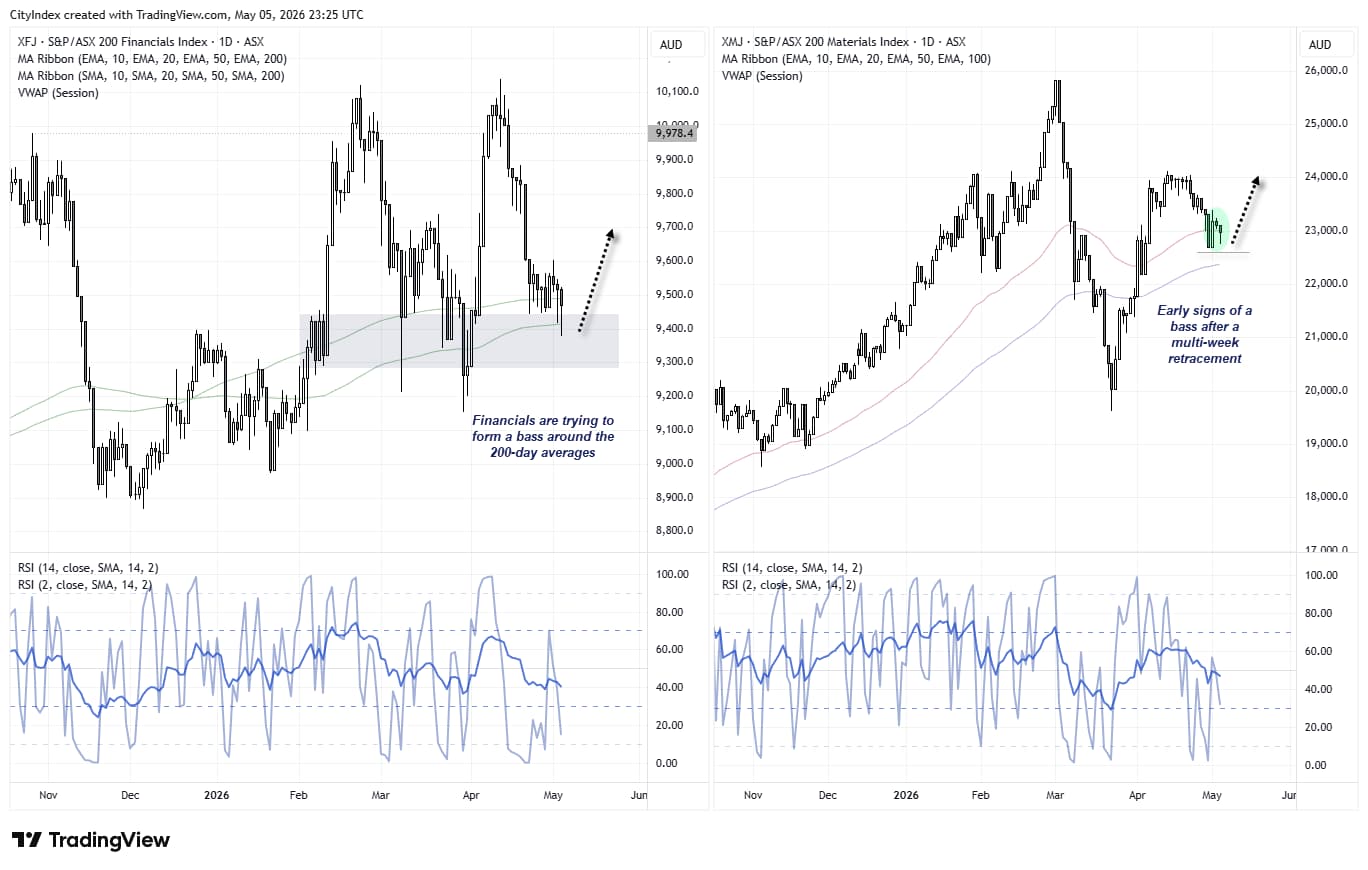
We need to see the financials and materials sectors print a swing low for the ASX 200 to have any real chance of a meaningful retracement higher. There are early signs, but caution is still warranted.
Financials (left) is attempting to base above the 200-day average, although it’s not yet clear if a swing low is in place. A bullish hammer formed on Tuesday, but momentum continues to drift lower.
Materials (right) has been trending lower, though early signs of a base are emerging around 23,000. A 20-bar bullish reversal formed last week, with prices reclaiming the 50-day EMA and holding above the 100-day EMA. A small bullish hammer also formed on Tuesday with a marginal higher low, suggesting a base may be forming.
Ultimately, ASX bulls should monitor these sectors for confirmation of a swing low before gaining confidence in longs.
Source: ASX, TradingView
ASX 200 Technical Analysis
ASX 200 GEX Levels and Outlook
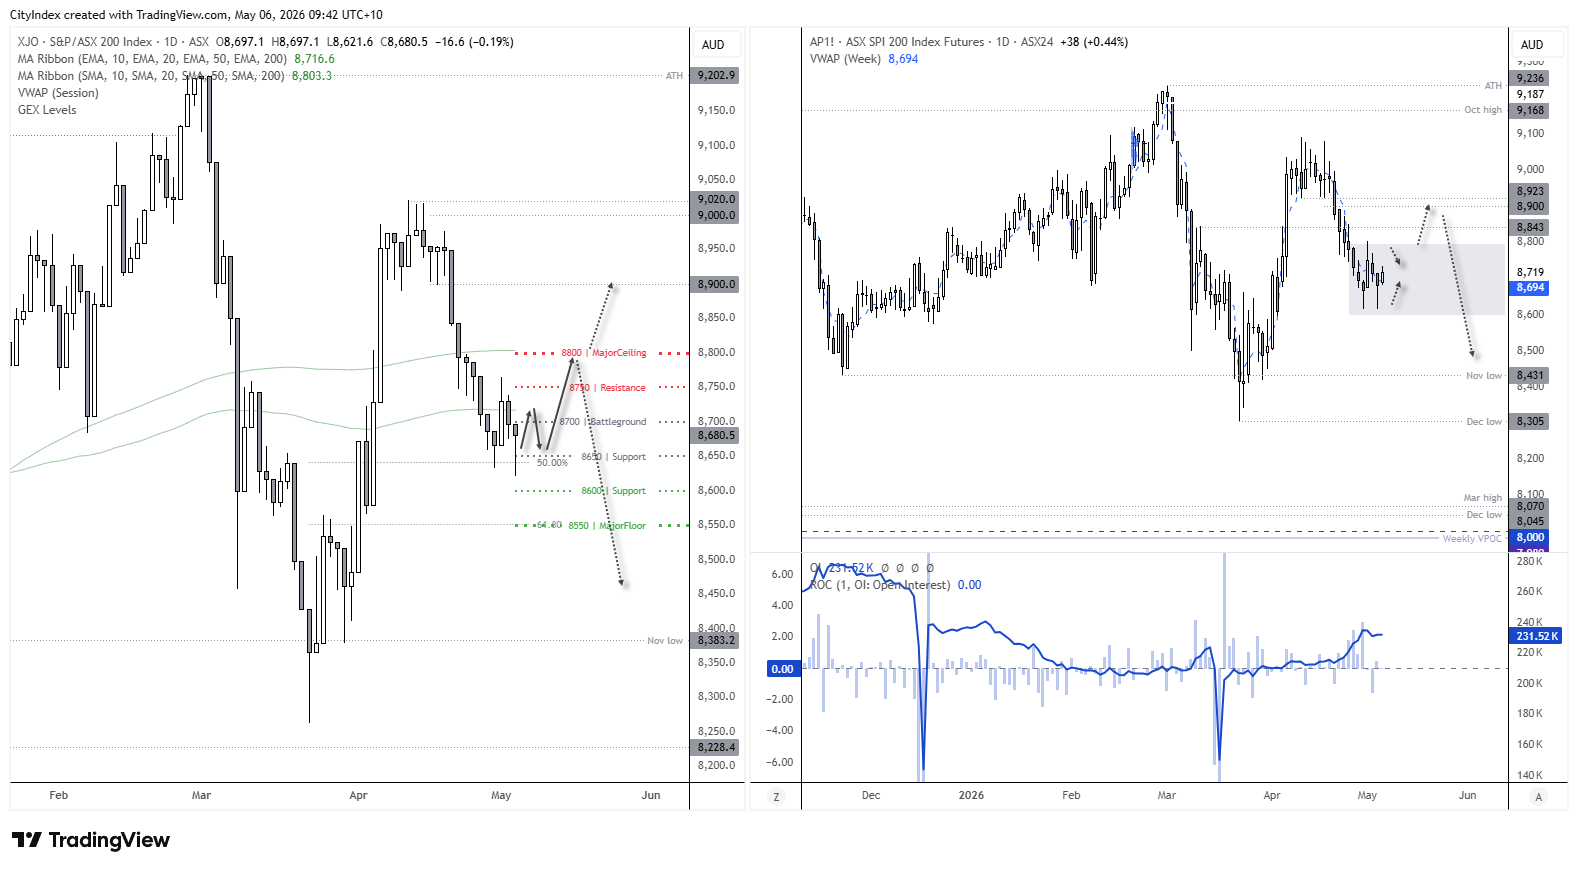
SPI 200 futures imply a higher open for the ASX 200 cash market but 8750–8800 is stacked with calls, so upside likely stalls unless we see clean acceptance above.
- 8700 is the magnet (balanced OI) → expect chop if price sits around it.
- 8600–8575 is the floor with solid put support → dips likely bought unless it breaks.

ASX 200 and SPI 200 Futures: Range Trade Signals with Upside Bias
The ASX 200 cash chart has found support around the 50% retracement level of the prior rally, with an options cluster sitting around 8650. Yet the 200-day EMA and 8700 handle are nearby, which could make price action scrappy for bulls over the near term.
Until we get a stronger bullish signal from the materials and financials sectors, traders may want to stick to intraday timeframes and seek bullish setups around range lows or fade into range highs.
Note on the SPI 200 futures chart (right) that open interest has ceased rising during falling prices, which indicates some short covering. But until we see prices rise alongside open interest, bulls remain sidelined and conditions could remain choppy.
Further out, my bias is for a move towards 8750 or 8800 after a period of choppy trade.
Source: ASX, ASX24, TradingView
View the full economic calendar
-- Written by Matt Simpson
Follow Matt on Twitter @cLeverEdge
How to trade with City Index
You can trade with City Index by following these four easy steps:
- Open an account, or log in if you’re already a customer
• Open an account in the UK
• Open an account in Australia
• Open an account in Singapore
- Search for the market you want to trade in our award-winning platform
- Choose your position and size, and your stop and limit levels
- Place the trade