



The ASX 200 is approaching a critical inflection point, with price pressing into the 8700 support zone after its most bearish run since June. While oversold conditions raise the risk of a near-term bounce, futures positioning and rising open interest suggest sellers remain in control. Traders now face a clear decision point: whether support can stabilise price in the short term, or give way to a deeper move lower.
View related analysis:
- Australian Dollar Outlook: AUD/USD Bulls Eye Breakout as CPI and FOMC Loom
- Japanese Yen Outlook: AUD/JPY Breakout Ahead of BOJ, USD/JPY Holds Steady
- FX Futures Positioning: US Dollar, EUR, JPY, CAD | COT report
- ASX 200 Outlook: CSL, COH, Drag Healthcare and ASX Lower
ASX 200 Tests 8700 Support as Bearish Momentum Holds
ASX 200 Market Snapshot
- The ASX 200 cash market fell for a fifth consecutive day – its most bearish daily sequence since June
- 9 of its 11 sectors declined – led by XUJ Utilities (-2.8%) and XEJ energy (-1.9%), XMJ materials (0.6%) led the two higher though healthcare was effectively flat
- The average daily range for the ASX on Tuesdays has been 109.2 points over the past three months, well above its 788.9 average over the past year
- The ASX is tracking the DAX and FTSE lower and being left for dust by Wall Street, with the S&P 500 and Nasdaq reaching fresh record highs heading into tech earnings
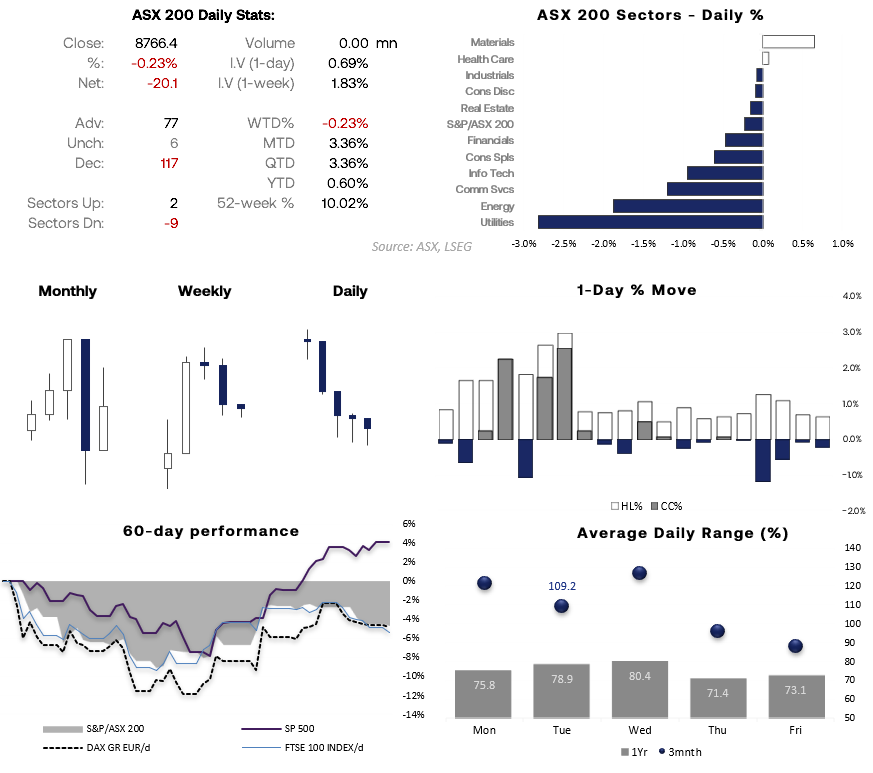
Source: ASX, LSEG
ASX 200 Correlations Signal Short-Term Noise, Longer-Term Risk Alignment
- Short-term (3-day): correlations unstable — ASX moving inversely to several markets → choppy, headline-driven trade
- 10–20 day: mixed signals — strong links to gold and FTSE, but divergence from US indices
- 60-day: broader risk-on alignment — ASX still positively correlated with global equities
- Takeaway: near-term noise, but bigger picture still tied to global risk sentiment
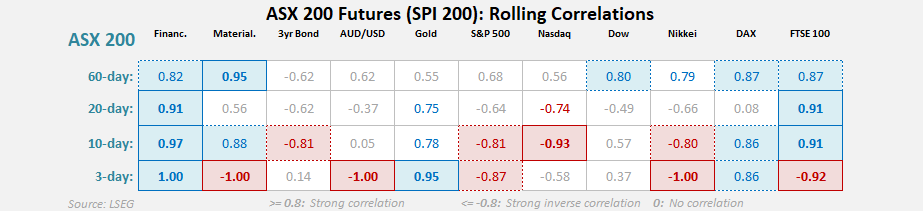
Source: ASX, LSEG

ASX 200 Technical Analysis
ASX 200 Slides Toward Key Support As Momentum Weakens
The daily chart shows the ASX 200 cash index declined for a fifth consecutive session on Monday — its most bearish run since June. The RSI (2) has been heavily oversold for several days, while the 200-day EMA sits nearby alongside the 8700 options barrier and prior swing lows, highlighting a potential support zone.
These factors point to a possible swing low, but with SPI 200 futures trading lower overnight and open interest rising — suggesting fresh shorts are entering — bulls may need to remain patient before stepping in.
ASX 200 Tests 8700 Support As Downside Pressure Builds
The ASX 200 is in a short-term downtrend, with futures pointing lower again and momentum rolling over. While 8900 remains a clear ceiling, the focus shifts to whether downside support can hold. Put positioning is clustered between 8750 and 8700, but it’s not especially strong at 8800 — leaving room for price to probe lower before finding firmer support.
That puts the spotlight on 8700 as the key floor, where stronger downside protection sits. Any bounces toward 8875 are likely to fade, keeping pressure on the downside unless we see clear acceptance back above resistance.
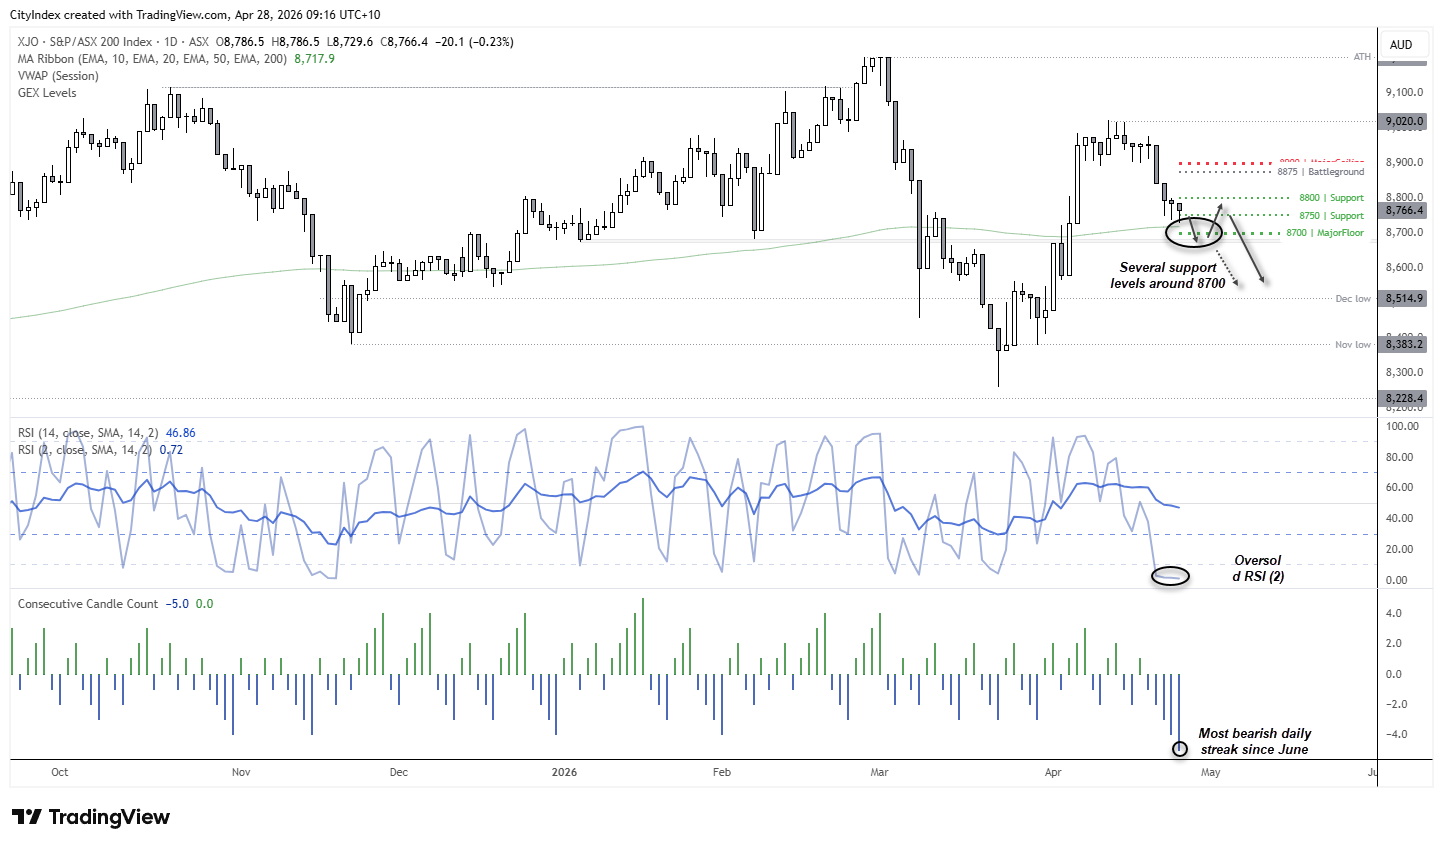
Source: ASX, TradingView

Futures Signal Bearish Pressure Into Key 8700 Support Zone
The ASX futures chart (left) shows open interest rising as prices fall, suggesting bears are driving the move rather than longs covering. The intraday ASX chart (right) highlights a confluence of support between 8663–8687, where the monthly pivot point, weekly S1, and prior swing lows align — making this a key zone to watch after the open.
With strong options positioning around 8700, bears may want confirmation before calling a sustained breakdown. A failure to hold below support could instead trigger a near-term bounce towards the weekly pivot point (8845).
- Pivotal zone around 8700 is key in the near term
- Break below 8700 opens downside towards 8660s support cluster
- If support holds, risk of a bounce towards ~8850
- Bias: near-term bounce, but rallies likely to fade below 8900
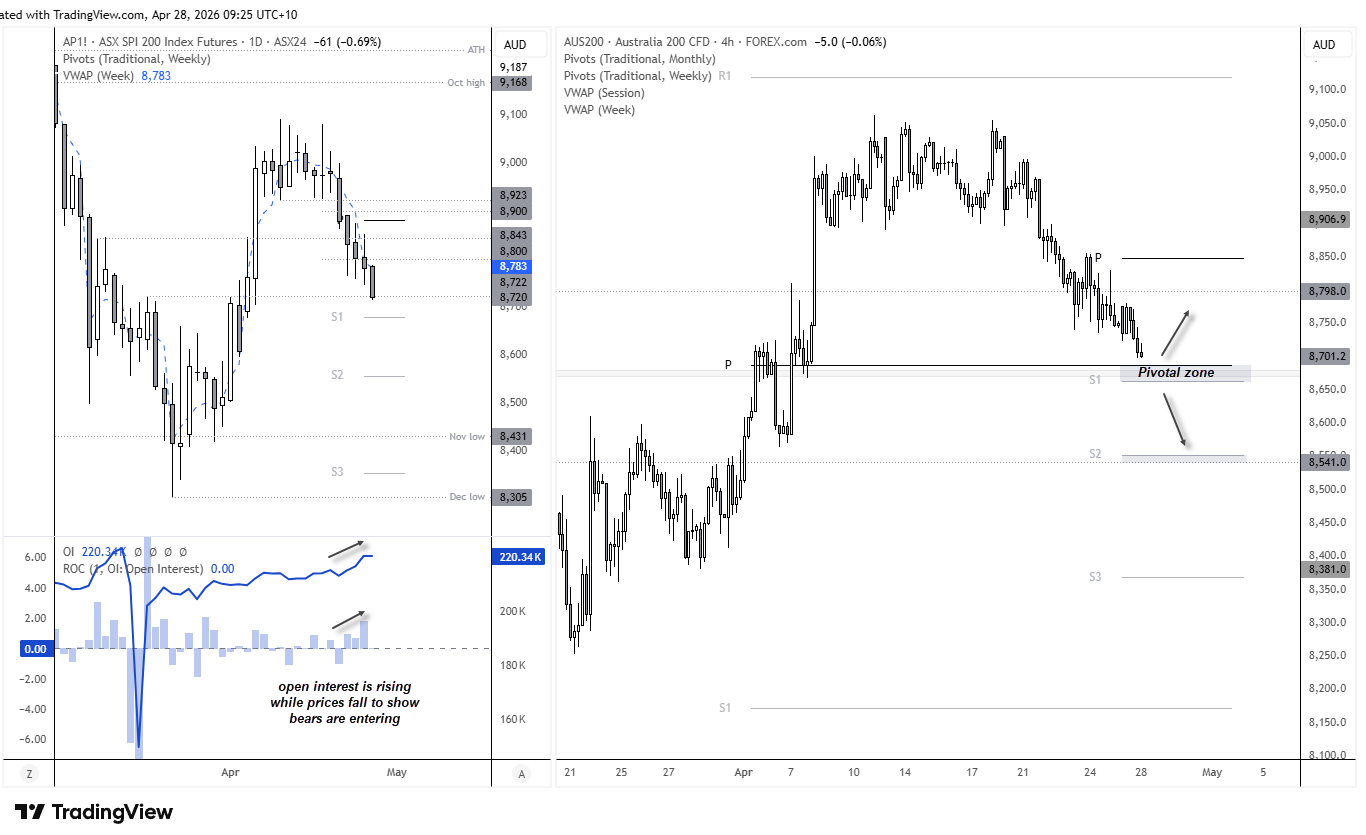
Source: ASX, ASX24, TradingView
View the full economic calendar
-- Written by Matt Simpson
Follow Matt on Twitter @cLeverEdge
How to trade with City Index
You can trade with City Index by following these four easy steps:
- Open an account, or log in if you’re already a customer
• Open an account in the UK
• Open an account in Australia
• Open an account in Singapore
- Search for the market you want to trade in our award-winning platform
- Choose your position and size, and your stop and limit levels
- Place the trade





