
The Japanese yen has weakened in the days following suspected MOF/BOJ intervention, with USD/JPY rebounding sharply. However, signals across yen pairs remain mixed, with EUR/JPY lagging and AUD/JPY showing relative strength.
View related analysis:
- Japanese Yen Intervention: Volatility Fades, But Turning Points Emerge
- AUD/USD Outlook: RBA Hike Priced In as Yields Ease, Momentum Fades
- Gold and Silver Outlook: Bearish Reversals Signal Further Downside
- FX Futures Positioning: USD, USD/JPY, GBP/USD, AUD/USD | COT Report
Intervention Hangover Fades, USD/JPY Bounces Back
It has been over three trading days since Japan’s MOF/BOJ allegedly intervened in the Japanese yen. While no official confirmation has arrived, the Nikkei news outlet reported that an intervention had indeed occurred within hours of the act. The surging yen saw USD/JPY print a daily high-to-low range in excess of 500 pips, which predictably had traders on edge for another round of intervention.
Yet I pointed out last week that history shows the significant baulk of volatility occurs on the day of intervention, and subsequent days over a week out sees reduced volatility and choppy trade. So far, that has mostly proven true regarding lower volatility, though this time around the Japanese yen has weakened over the past three days – and momentum has picked up in the past 24 hours as the moves of Thursday retrace.
The question now of course is whether we’ll see another round of bearish momentum for USD/JPY. Technically, a case for one is building. And as outlined in Friday’s article, interventions often align with meaningful tops in USD/JPY, with bearish control typically persisting for weeks or even months thereafter.
Source: LSEG
Post-Intervention Volatility Eases, Returns Remain Inconsistent in Yen Pairs
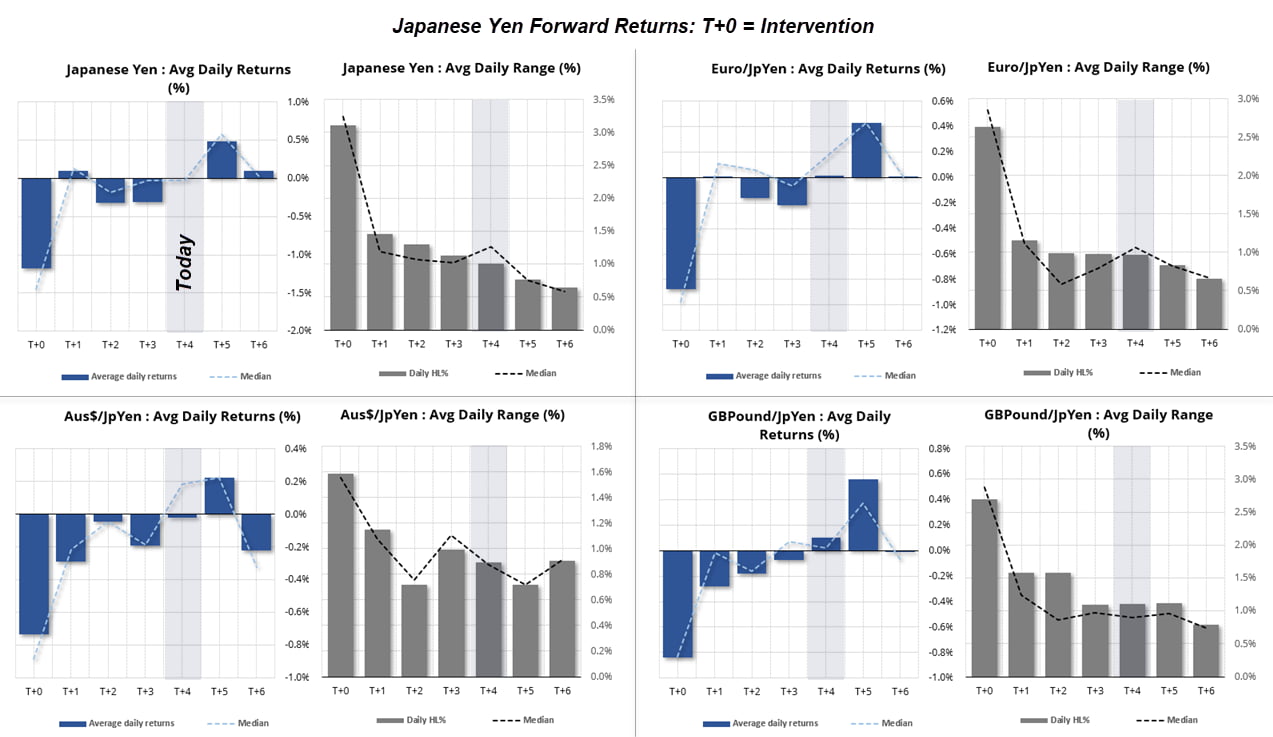
The forward returns charts show average returns and volatility levels of yen pairs from the day of intervention (T+0) through to six days after (T+6). The daily volatility levels clearly show diminishing ranges on USD/JPY, and while they’re not quite as consistent on AUD/JPY, EUR/JPY and GBP/JPY we can see they generally trend lower.
Yet daily returns are mostly inconsistent among USD/JPY and the yen crosses. Though the exception is GBP/JPY which shows decreasingly negative returns from T+1 to T+3 before rising on T+4 and T+5.

USD/JPY Technical Analysis: US Dollar vs Japanese Yen
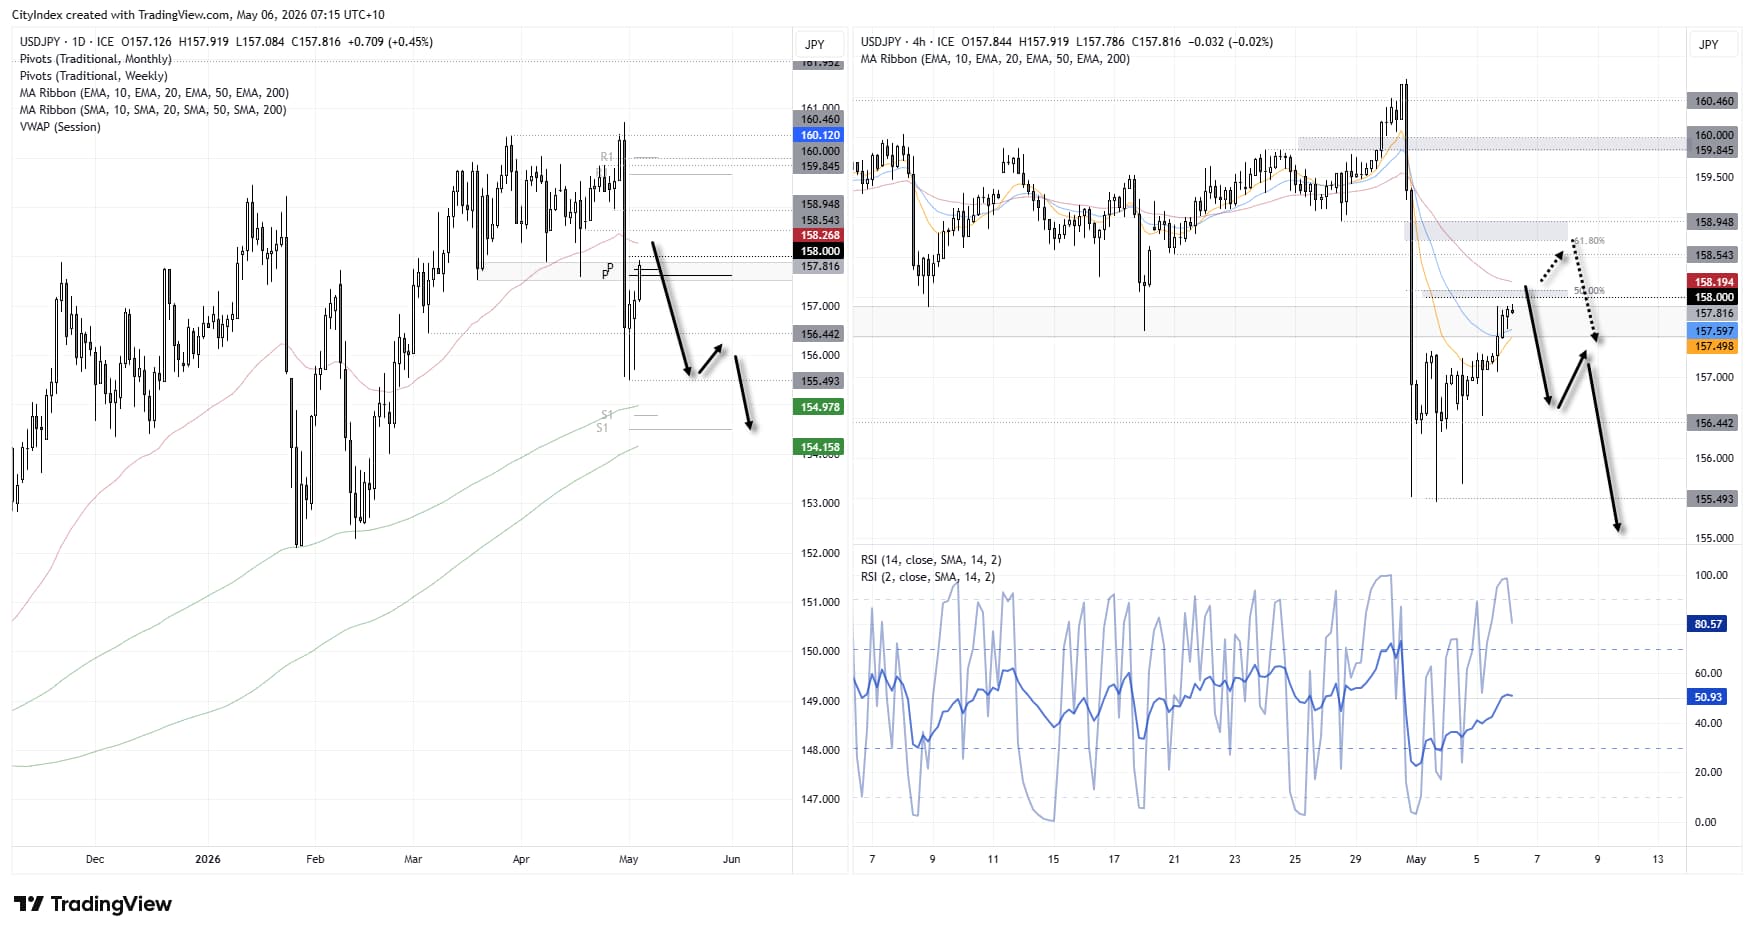
The daily chart shows USD/JPY has pushed to a four-day high after printing two bullish hammer candles near Thursday’s low. Momentum picked up on Tuesday alongside a modest risk-on tone, with Wall Street hitting fresh highs while crude oil and the yen softened—the latter the weakest major FX currency.
USD/JPY has edged above its weekly and monthly pivot points but stalled ahead of the 158 handle. With the 50-day EMA nearby at 158.27 acting as potential resistance, I’m now looking for signs of a swing high to signal the next leg lower.
The 4-hour chart shows the 50% retracement of last week’s decline sits just above 158, making it a key level to watch for a potential swing high. If price pushes higher, resistance is layered between 158.71 (61.8% retracement) and 158.95 (prior swing low), just ahead of the 159 handle.
If bears regain control, a daily close below 156.44 would be constructive. A break of the cycle low at 155.49 opens the door to a move towards 155, with the 200-day EMA (154.98) and 200-day SMA (154.15) just below. The weekly and monthly S1 pivots sit between these averages, making the 154–155 zone a potentially sticky support region if reached.
Source: ICE, TradingView

EUR/JPY Technical Analysis: Euro vs Japanese Yen
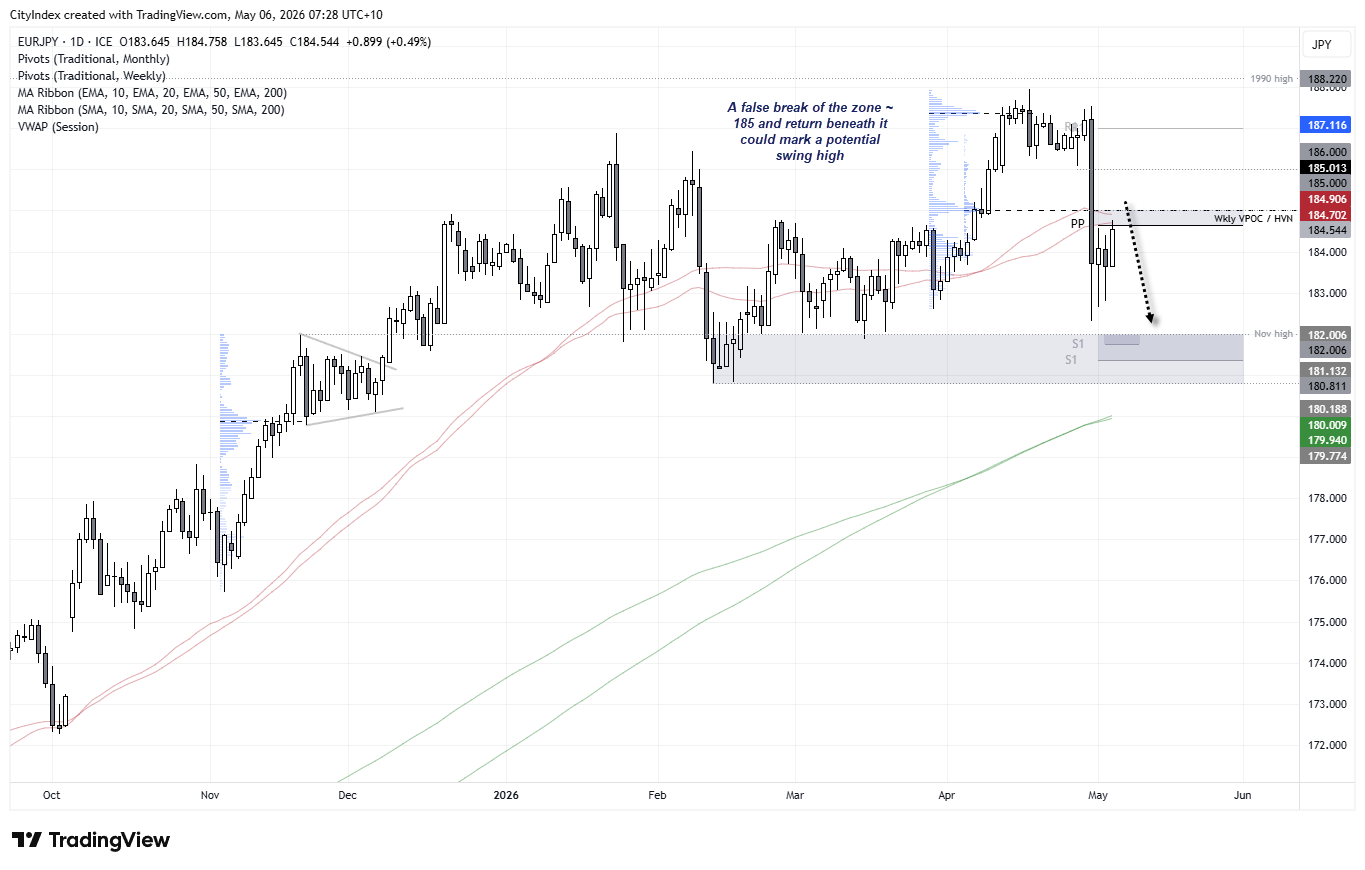
While a similar setup is seen on EUR/JPY, euro bulls have been relatively lacklustre against the yen. Prices are also approaching a tight resistance zone between the monthly pivot (184.65) and the 50-day EMA / HVNs around 184.90, just below the 185 handle.
I prefer to allow some wriggle room when identifying potential swing highs, rather than treating these zones as precise levels for price to respect. However, when such clusters form, a false break above 185 followed by a move back below would be a strong signal that a swing high may be in place.
If bearish momentum returns, the November high near 182, along with S1 pivots and the 181.12 swing low, present viable downside targets.
Source: ICE, TradingView
AUD/JPY Technical Analysis: Australian Dollar vs Japanese Yen
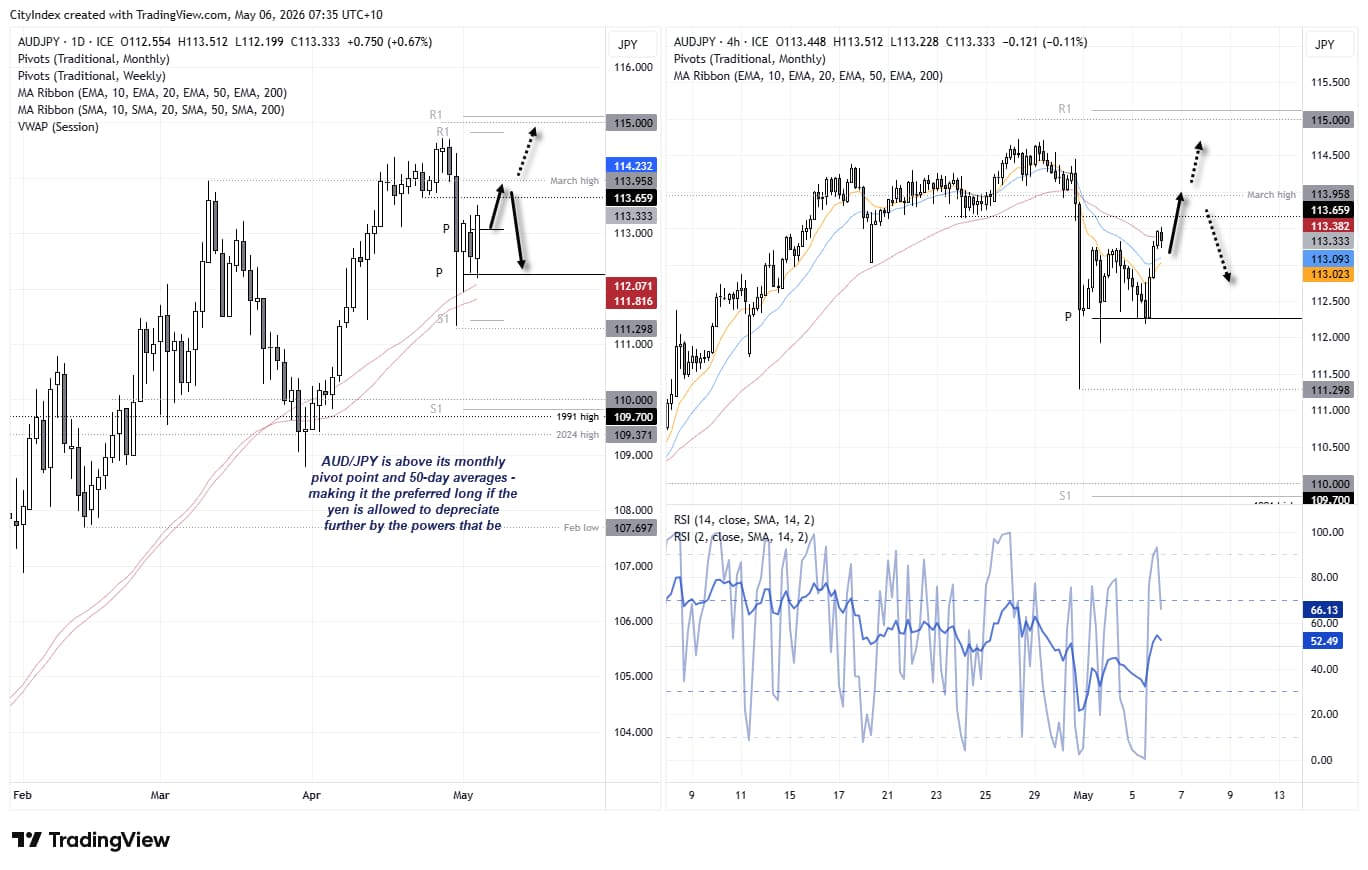
This is the outlier of the three, with AUD/JPY the only pair trading above both of its 50-day averages. Intraday momentum also picked up during the US session, and while the RBA delivered a hawkish hike—albeit slightly less so than some expected—it still makes AUD/JPY relatively less attractive to bears compared with EUR/JPY and USD/JPY.
That said, any renewed intervention from the MOF/BOJ would likely weigh on AUD/JPY as well. But if the yen continues to weaken, AUD/JPY stands out as the more compelling long, having held up best during the recent bout of yen strength.
A move towards 114.30 looks plausible, though I’d keep upside targets conservative for now. Bulls may prefer to take a cautious approach, allowing room for a potential reversal should yen strength re-emerge and a swing high form on AUD/JPY.
Source: ICE, TradingView
View the full economic calendar
-- Written by Matt Simpson
Follow Matt on Twitter @cLeverEdge
How to trade with City Index
You can trade with City Index by following these four easy steps:
- Open an account, or log in if you’re already a customer
• Open an account in the UK
• Open an account in Australia
• Open an account in Singapore
- Search for the market you want to trade in our award-winning platform
- Choose your position and size, and your stop and limit levels
- Place the trade