
Bitcoin Technical Forecast: BTC/USD Weekly & Daily Trade Levels
- BTC/USD is poised to mark a third consecutive weekly decline after reversing from the monthly highs.
- Price is approaching a major support zone that could determine the fate of the February uptrend.
- A break below support would signal a larger trend reversal and open the door to deeper losses heading into June.
- Stabilization above support could set the stage for a recovery and another challenge of the recent highs.
Bitcoin remains under pressure after reversing sharply from the monthly highs, with BTC/USD now approaching a major support zone that could prove pivotal for the broader trend. The three-week decline follows a failed breakout attempt and has brought price back toward the lower bounds of the February advance. The focus now shifts to whether buyers can defend this region and stabilize the selloff, or if a break lower signals a more significant trend reversal is underway. Battle lines drawn on the BTC/USD technical charts heading into June.
Bitcoin Price Chart – BTC/USD Weekly
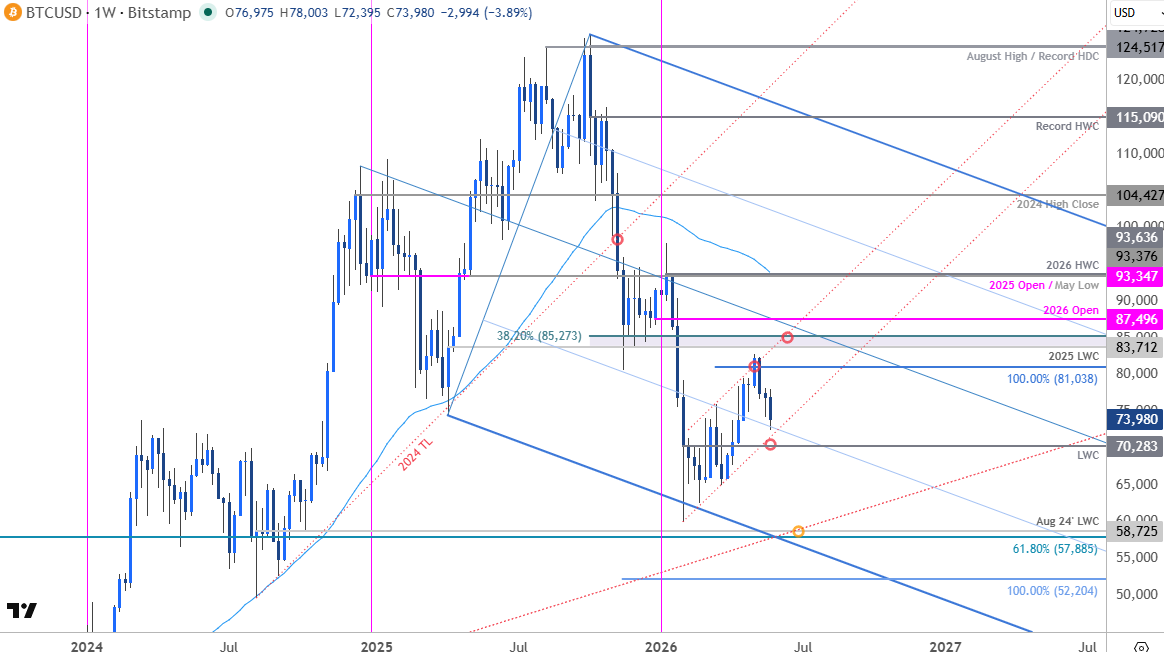
Chart Prepared by Michael Boutros, Sr. Technical Strategist; BTC/USD on TradingView
In my last Bitcoin Forecast we noted that BTC/USD had broken out of a multi-month downtrend and that, “From a trading standpoint, losses should be limited to 74,434 IF price is heading higher on this stretch with a close above 79,127 needed to fuel a push towards 81,038- look for a larger reaction there IF reached for guidance.” Bitcoin broke higher the following week and a despite marking a weekly close above 81,038, the bulls were unable to sustain the move with price reversing sharply lower the following week.
The decline has extended more than 12.5% off the monthly high with price poised to mark a third consecutive weekly decline for the first time since February. The losses take BTC/USD towards confluent support at the lower bounds of the February uptrend, and the focus is on a reaction off this slope.

Bitcoin Price Chart – BTC/USD Daily
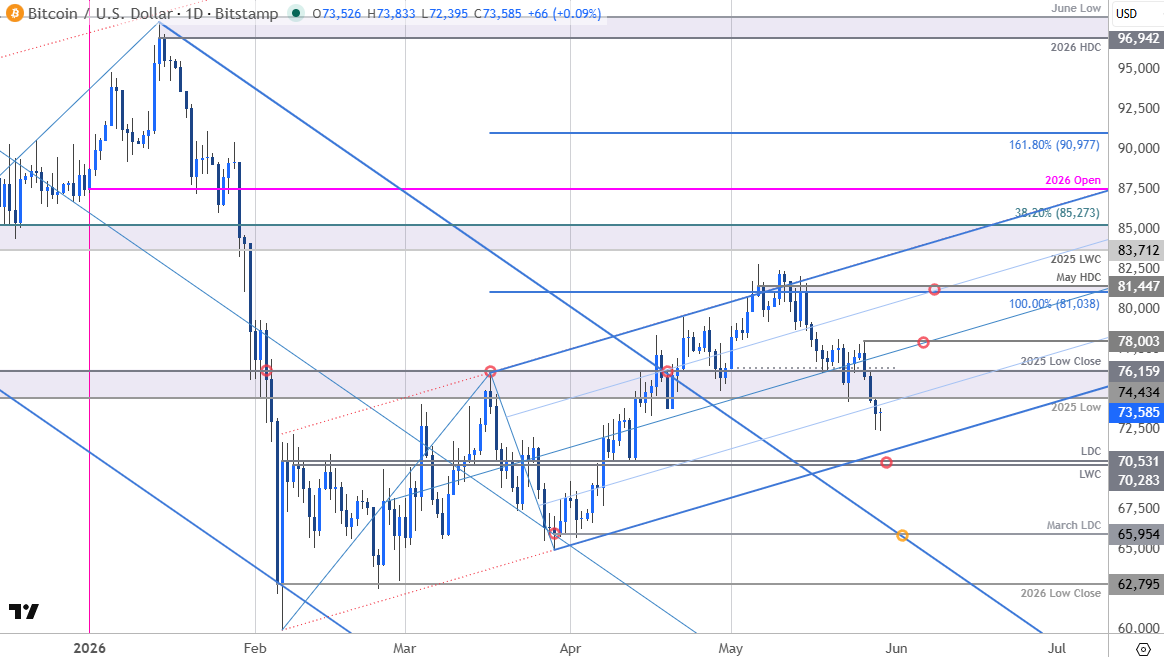
Chart Prepared by Michael Boutros, Sr. Technical Strategist; BTC/USD on TradingView
A closer look at the Bitcoin daily chart shows BTC/USD continuing to trade within the confines of the ascending pitchfork we have been tracking off the March low. This week’s break of the May range lows threatens a test of this uptrend in the days ahead. Key lateral support rests with the yearly low week / low-day closes (LWC / LDC) at 70,283/531- losses below this zone would be needed suggest a more significant high is in place and invalidate the February uptrend. Subsequent support objectives rest with the March low-day close (LDC) at 65,954 and the yearly low close at 62,795.
Initial resistance is now eyed at former support at 76,159 and is backed closely by this week’s high at 78,003. Note that the median-line converges on this level early next month and a breach / daily close above would be needed to mark uptrend resumption with key resistance steady at the 100% extension of the February advance and the May high-day close (HDC) at 81,038/447. Subsequent resistance objectives eyed at the 2025 LWC and the 38.2% retracement of the October decline at 83,712-85,273 and the 2026 yearly open at 87,496.
Bottom line: A false breakout of uptrend resistance is now approaching uptrend support- looking for a potential exhaustion low early in the month. From a trading standpoint, losses would need to be limited to 70,283 for the February uptrend to remain viable with a close above 78,003 needed to fuel the next leg of the advance towards the May highs.
--- Written by Michael Boutros, Senior Technical Strategist
Follow Michael on X @MBForex