

The last week of May is coming to an end, and the cryptocurrency market is once again showing broad weakness. All major cryptocurrencies closed the week in negative territory, while Bitcoin, the market’s reference asset, also posted a significant decline and reached weekly lows near the $70,000 area.
For now, the selling bias appears to have returned with more strength. Current pressure reflects a lack of demand appetite that could remain relevant for cryptocurrencies over the coming trading sessions.

Performance of major cryptocurrencies
Source: Data - StoneX, Tradingview
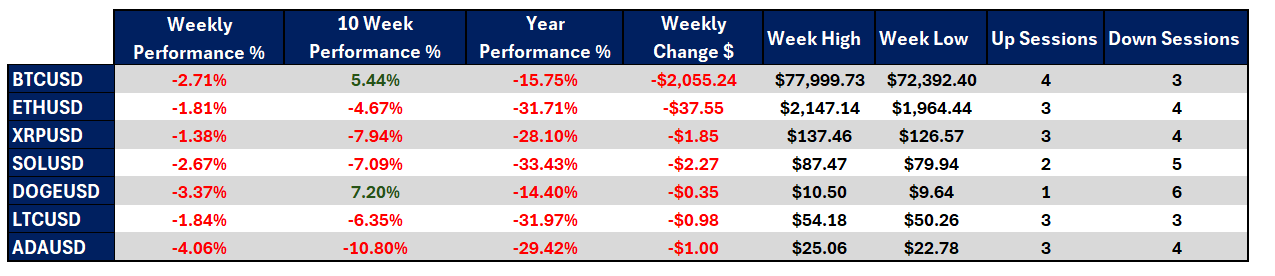
- All major cryptocurrencies posted declines over the last seven trading sessions, reflecting broad short-term weakness. The most affected cryptocurrency of the week was Cardano, with a decline of more than -4.00%, positioning it as the asset with the strongest selling pressure within the observed group. Meanwhile, Ripple showed the highest relative stability, with a decline of around -1.38%. However, the broader market dynamic continues to show a significant loss of appetite in recent sessions.
- Over the past ten weeks, the crypto market has shown a mixed dynamic, with some cryptocurrencies maintaining medium-term gains while others continue to reflect more consistent weakness. In this scenario, Dogecoin stands out with a gain of 7.2%, positioning itself as the most stable cryptocurrency over the medium term. In contrast, Cardano once again shows notable weakness, with a decline of -10.80%, making it the most affected asset over this period as well.
- Year-to-date, the market still faces an important challenge, as none of the major cryptocurrencies have managed to trade above their 2026 opening prices. Solana remains the most affected, with a decline of -33.43%, while Dogecoin once again stands out for its relative stability, with a decline of -14.40%. Overall, the crypto market has not managed to consolidate a positive year, reflecting a more structural lack of appetite over the long term.
- Bitcoin, as the market benchmark, stands out for its weakness during the week. The price has lost around $2,000, and weekly lows remain close to the 70k barrier, moving further away from the 80k reference area. Rather than providing confidence to the broader market, recent BTC price action continues to reinforce weakness that may also be spreading to the rest of the crypto market.
- Overall, most of the market reflects an increasingly evident phase of weakness. As long as no relevant new highs appear, this environment could continue to favor the emergence of selling biases across cryptocurrencies over the coming trading sessions.
Color scale from red to green – Red for negative correlations and green for positive correlations
Source: Data - StoneX, Tradingview
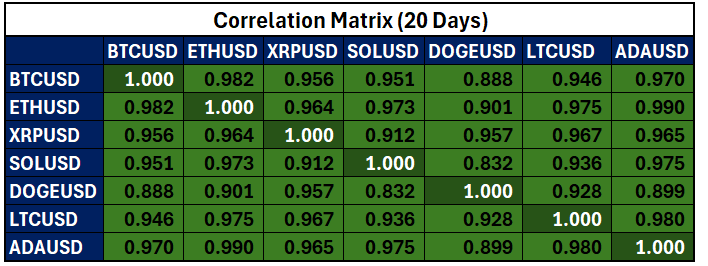
From a correlation standpoint, the relationship between major cryptocurrencies and Bitcoin has increased again. At the moment, correlation coefficients remain above 0.85, reflecting a strong positive relationship between BTC and the rest of the market over the last 20 trading sessions. It is important to remember that the correlation coefficient can change over time.
Far from showing optimism, this behavior reflects a market alignment toward weakness. As Bitcoin has shown short-term selling pressure, no major cryptocurrency has managed to separate itself from this dynamic, suggesting that the selling bias is once again becoming a relevant factor for the broader market.
In this context, although some cryptocurrencies are trying to maintain a degree of stability, the lack of appeal in the crypto market is becoming increasingly evident. If BTC fails to regain stability in the coming sessions, the current selling bias could continue to affect the market in a relevant way.
Bitcoin faces a dangerous selling bias
Source: StoneX, Tradingview
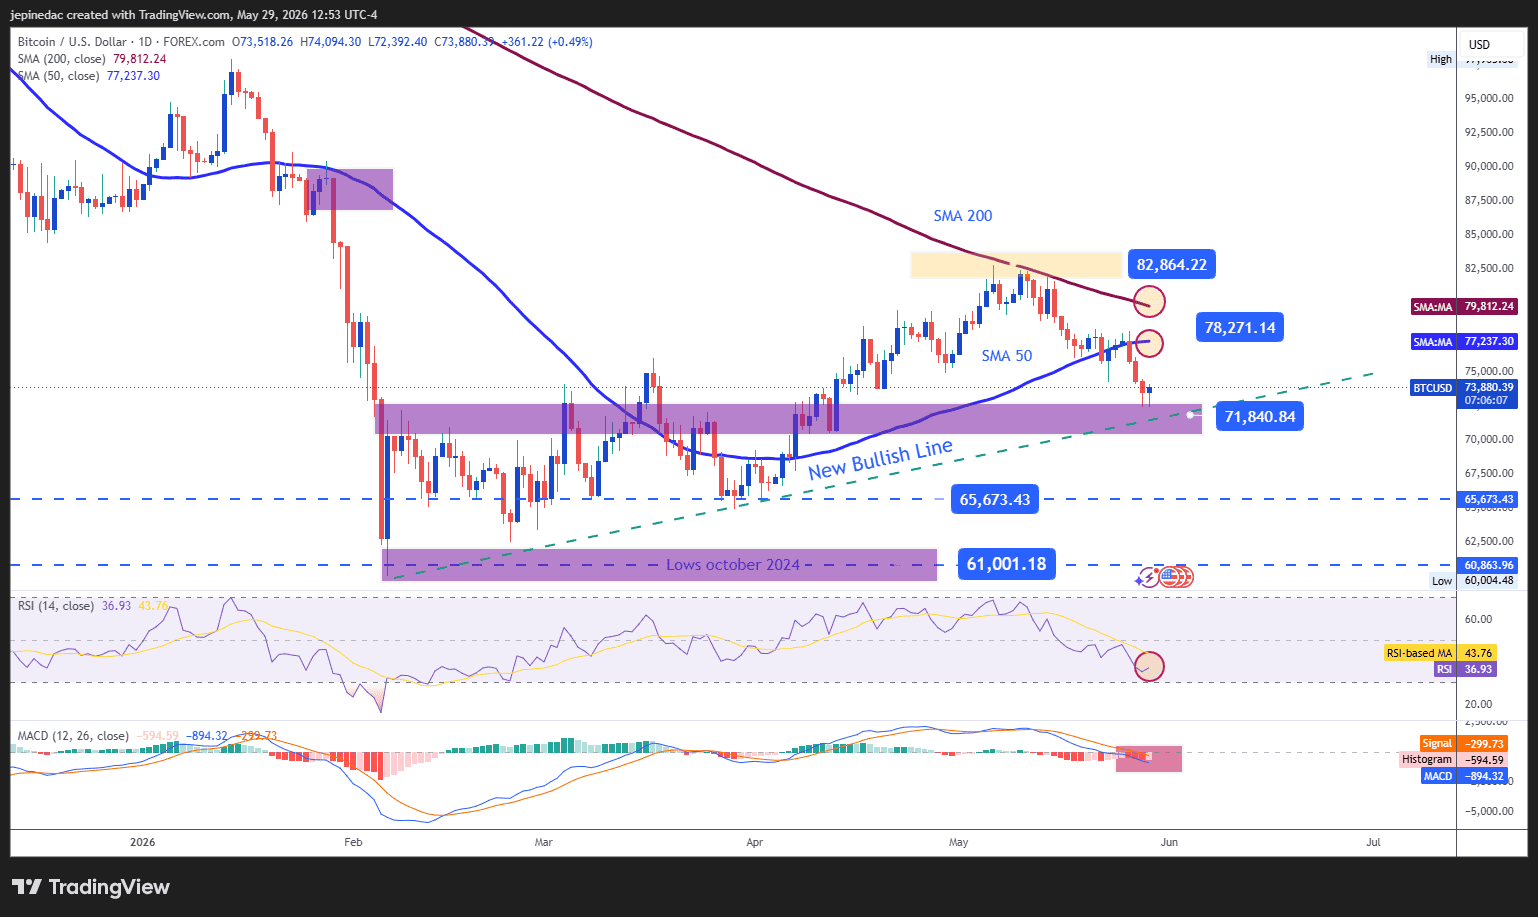
Over the past few weeks, Bitcoin’s average price action had started to open the door to the possible formation of a bullish trendline. However, recent weakness is once again calling this structure into question. If selling pressure continues to dominate short-term price action, the chart structure could shift, giving more relevance to a stronger selling bias over the coming sessions.
Indicators:
- At the moment, the RSI remains below the neutral 50 line, while the MACD continues to show a histogram below the 0 line. This indicates that both the average momentum of the last 14 sessions and the strength of short-term moving averages continue to show selling dominance. If this dynamic continues, bearish pressure could remain relevant over the coming sessions.
Key levels:
- 82,800 USD – Important resistance: A recent high area that stands as the most relevant upside barrier to watch. Price movements toward this level could reactivate a buying bias and open the door to a possible extension of the bullish trendline over the coming weeks.
- 78,200 USD – Near-term barrier: A relevant neutrality level located between the 200- and 50-period moving averages. Moves too close to this zone could highlight a phase of indecision and open the door to a potential sideways range.
- 71,800 USD – Definitive support: A relevant low area that acts as the main downside barrier. Moves toward this level could put the current bullish trend line at risk and open the door to a more relevant selling bias over the coming weeks.
Cardano is the most affected cryptocurrency of the week
Source: StoneX, Tradingview
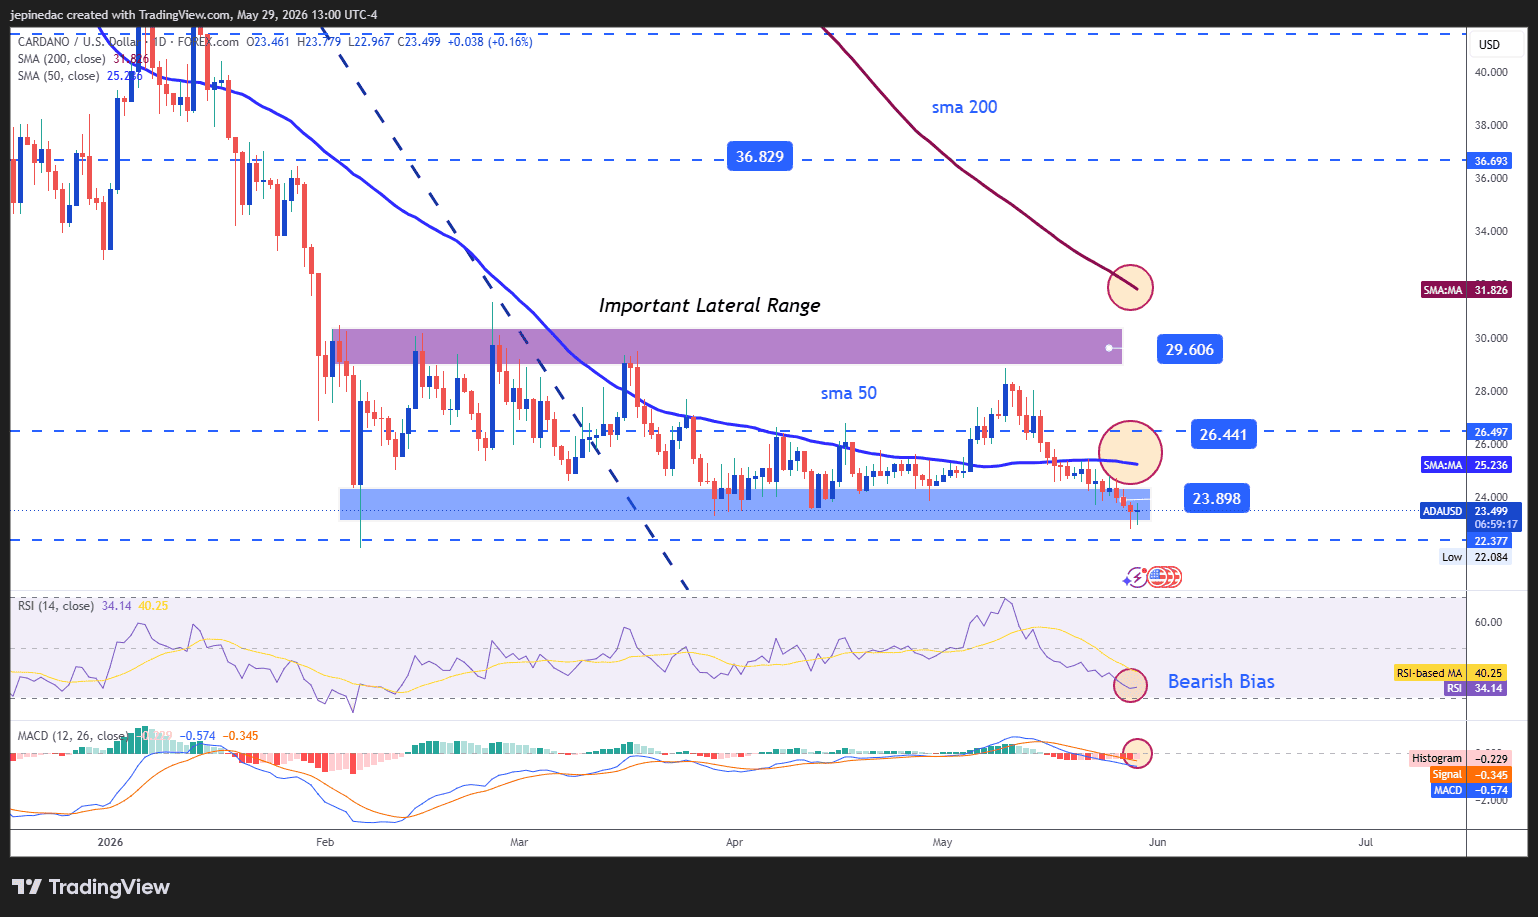
Cardano is currently the cryptocurrency showing the most weakness in the short and medium term. The key point is that selling pressure is testing the lower boundary of a sideways channel that has been relevant on the daily chart over the past few weeks. If this pressure continues, it could open the door to the formation of a clearer bearish structure in Cardano over the coming sessions.
Indicators:
- At the moment, both the MACD and the RSI remain below their neutral levels, located at 0 and 50, respectively. This reflects that short-term strength continues to tilt toward a selling bias, which could remain in place if the indicators continue to show this dynamic.
Key levels:
- 29.60 – Important resistance: This level corresponds to the upper boundary of the current sideways range on the chart. Price action that manages to break above this level could open the door to a more relevant buying bias and a possible bullish trendline formation over the coming weeks.
- 26.44 – Near-term barrier: A relevant neutrality level located in the middle of the sideways range. If price remains around this zone in the short term, a phase of indecision could be reinforced and the sideways range could continue as the dominant chart pattern.
- 23.89 – Main support: A 2026 low that corresponds to the most important downside barrier to watch. A break below this level could open the door to a relevant selling bias, capable of dominating Cardano’s movements and allowing the formation of a more important bearish structure over the coming sessions.
Written by Julian Pineda, CFA, CMT – Market Analyst
Follow him on: @julianpineda25