Bitcoin Technical Forecast: BTC/USD Weekly & Daily Trade Levels
- BTC/USD has surged from the March low, breaking out of a multi-month downtrend.
- The rally is now approaching the first key resistance hurdles following the breakout.
- A hold above former resistance would support continuation of the advance.
- The next move hinges on whether buyers can sustain control at current levels.
Bitcoin has staged a powerful recovery in recent weeks, with BTC/USD breaking out of a multi-month downtrend and establishing a strong upside bias. The move reflects a decisive shift in momentum following the early-year selloff, with price now approaching a key resistance zone that could determine the next phase of the advance. The reaction at this level will be critical in assessing whether the breakout has further room to run or if the rally begins to lose steam. Battle lines drawn on the BTC/USD technical charts heading into May.
Bitcoin Price Chart – BTC/USD Weekly
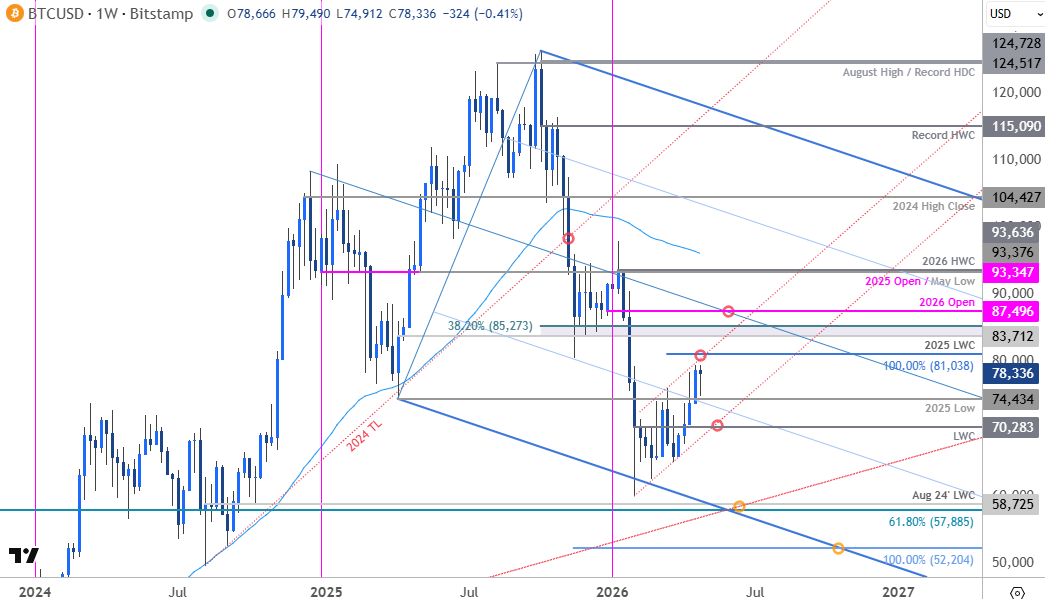
Chart Prepared by Michael Boutros, Sr. Technical Strategist; BTC/USD on TradingView
In my March Bitcoin Forecast we noted that BTC/USD was testing key technical resistance and that, “From a trading standpoint, rallies would need to be limited to 76,159 IF price is heading lower on this stretch with a close below 66,074 needed to fuel the next major leg of the decline.” Bitcoin plunged more than 14.5% off those highs and despite marking a weekly close at 65,954, the bears could not sustain the break. The subsequent rebound has now climbed more than 20% off the March lows with the rally breaking above pivotal resistance last week at the 2025 swing low / low close at 74,434-76,159. Note that the 25% parallel converged on this threshold and the breakout suggests a larger recovery may be underway.

Bitcoin Price Chart – BTC/USD Daily
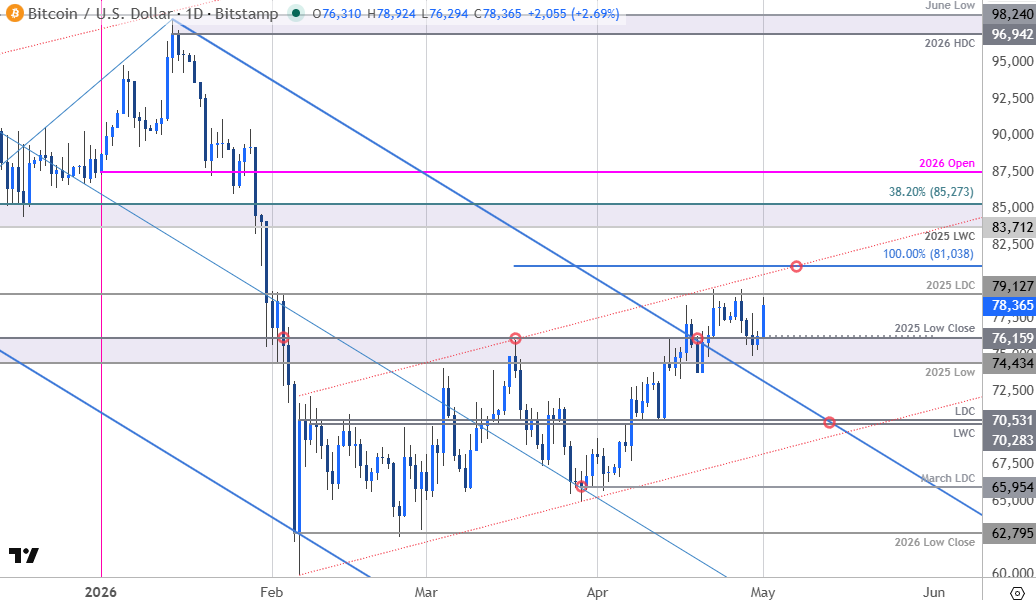
Chart Prepared by Michael Boutros, Sr. Technical Strategist; BTC/USD on TradingView
A closer look at the Bitcoin daily chart shows BTC/USD breaking out of the January pitchfork with an embedded ascending channel guiding the advance off the yearly low. Initial support rests back at the 74,434-76,159 pivot zone with medium-term bullish invalidation now raised to the low-week & low-day closes (LWC / LDC) at 70,283/531. Losses below this threshold would be needed to suggest a more significant high is in place and a larger breakdown is underway. Subsequent support rests at the March low-day close at 65,954 and the yearly low-close at 62,795.
Initial resistance has already been tested twice at the 2025 low-day close at 79,127 and is backed closely by the 100% extension of the February advance at 81,038. Note that channel resistance converges on this threshold in the first half of the month and a breach / weekly close above is needed to fuel the next leg of the advance. Subsequent resistance objectives eyed at the 2025 LWC and the 38.2% retracement of the October decline at 83,712-85,273 and the 2026 yearly open at 87,496.
Bottom line: Bitcoin has rallied more than 31% off the yearly low with BTC/USD breaking out of a multi-month downtrend. The rally is now approaching the first major test of resistance. From a trading standpoint, losses should be limited to 74,434 IF price is heading higher on this stretch with a close above 79,127 needed to fuel a push towards 81,038- look for a larger reaction there IF reached for guidance.
--- Written by Michael Boutros, Senior Technical Strategist
Follow Michael on X @MBForex