
The US dollar is holding within a tight range ahead of today’s US CPI report, as traders assess whether elevated oil prices linked to the Iran conflict continue to fuel inflationary pressures. While the broader bearish USD thesis remains intact for now, USD/JPY is rebounding towards key resistance near 158 following suspected intervention from Japan’s Ministry of Finance.
View related analysis:
- How to Read the COT Report to Track Forex Market Sentiment
- FX Futures Positioning: USD Index, USD/JPY, USD/CAD | COT Report
- AUD/USD Outlook: Aussie Buoyant Ahead of Trump-Xi Summit
- AUD/USD, NZD/USD Extend Gains, Though AUD/NZD Flashes Reversal Risk
- USD/JPY Plunges from 158 as Yen Surges on Another Suspected Intervention
US Dollar and USD/JPY Setups in Focus Ahead of US CPI
US CPI Report Could Dictate Near-Term Direction for the US Dollar
The US dollar is trading within a narrow range heading into today’s US CPI report, which is attracting plenty of attention as traders assess how much the conflict in Iran — and the resulting surge in oil prices — continue to influence inflationary pressures.
With the latest peace proposal rejected, there is no immediate end in sight for elevated crude oil prices. And that suggests inflationary pressures are also likely to remain elevated. While most agree that the worst of the conflict is behind us, markets appear to have largely priced in the roughly 20% supply shock.
US core CPI is expected to rise to 0.3% from 0.2%, while headline CPI is forecast to increase by 0.6% following the 0.9% spike the month prior. That could lift annual headline inflation to 3.7% y/y. The US dollar’s direction is likely to hinge on which side of expectations CPI lands. A hotter-than-expected print could hand USD bulls a near-term boost — although, as I explain below, such rallies may ultimately be viewed favourably by bears looking to fade strength. A softer set of CPI figures could instead allow bears to regain control sooner and push the dollar beneath last week’s lows.
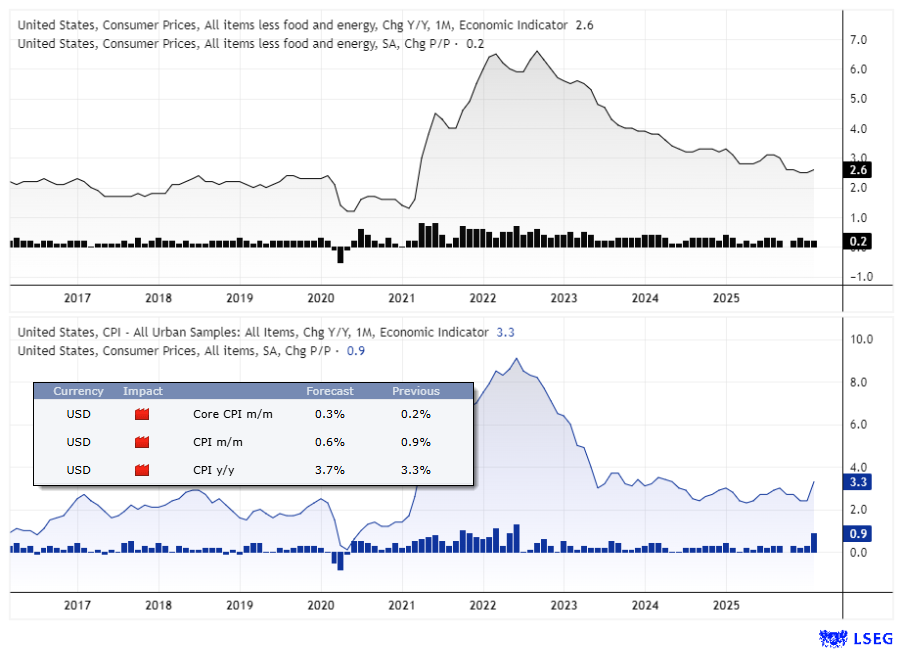
Source: BLS, Forex Factory, LSEG
US Dollar Index (DXY) Technical Analysis
Bearish US Dollar Thesis Still Intact for Now
I continue to work with the assumption that a meaningful top was printed on the US dollar on March 31 at 100.50, marking the end of an ABC countertrend move against the sharp decline from 108.26 in January 2025. If that view proves correct, it would also imply an eventual break beneath the 95 lows later in the year.
High oil prices stemming from Iran’s closure of the Strait of Hormuz are clearly a bump in the road for now. However, the fact the US dollar is still being allowed to weaken as traders scale back concerns over further Fed hikes is an encouraging sign for the broader bearish USD thesis.
But we also need to be on guard for upside inflation surprises, which could prove supportive for the US dollar over the near term.

US Dollar Index Coils Above Support Ahead of US CPI
The daily chart shows the US dollar index has found support just above the 97.37 high-volume node (HVN), with a double bottom forming around 97.50. The lower wicks around that level also highlight underlying demand.
With prices coiling above last week’s lows heading into today’s US CPI report, I have the technical hunch that the US dollar could be due for a pop higher, given it has established a base above last week’s demand zone. That could see the US dollar index retest the 50-day and 200-day EMA near 98.40, alongside the monthly pivot point, over the near term. It would also make for a logical area where bears may reconsider shorts.
Naturally, I’d expect the USD to roll over if CPI comes in refreshingly soft, in which case the 97.37–97.50 support zone could become the next target for bears. A break beneath that area opens the door for a move towards the 96.15 HVN and February low at 96.12. These same bearish targets also apply should a swing high form up to or around the 98.40 resistance cluster mentioned above.
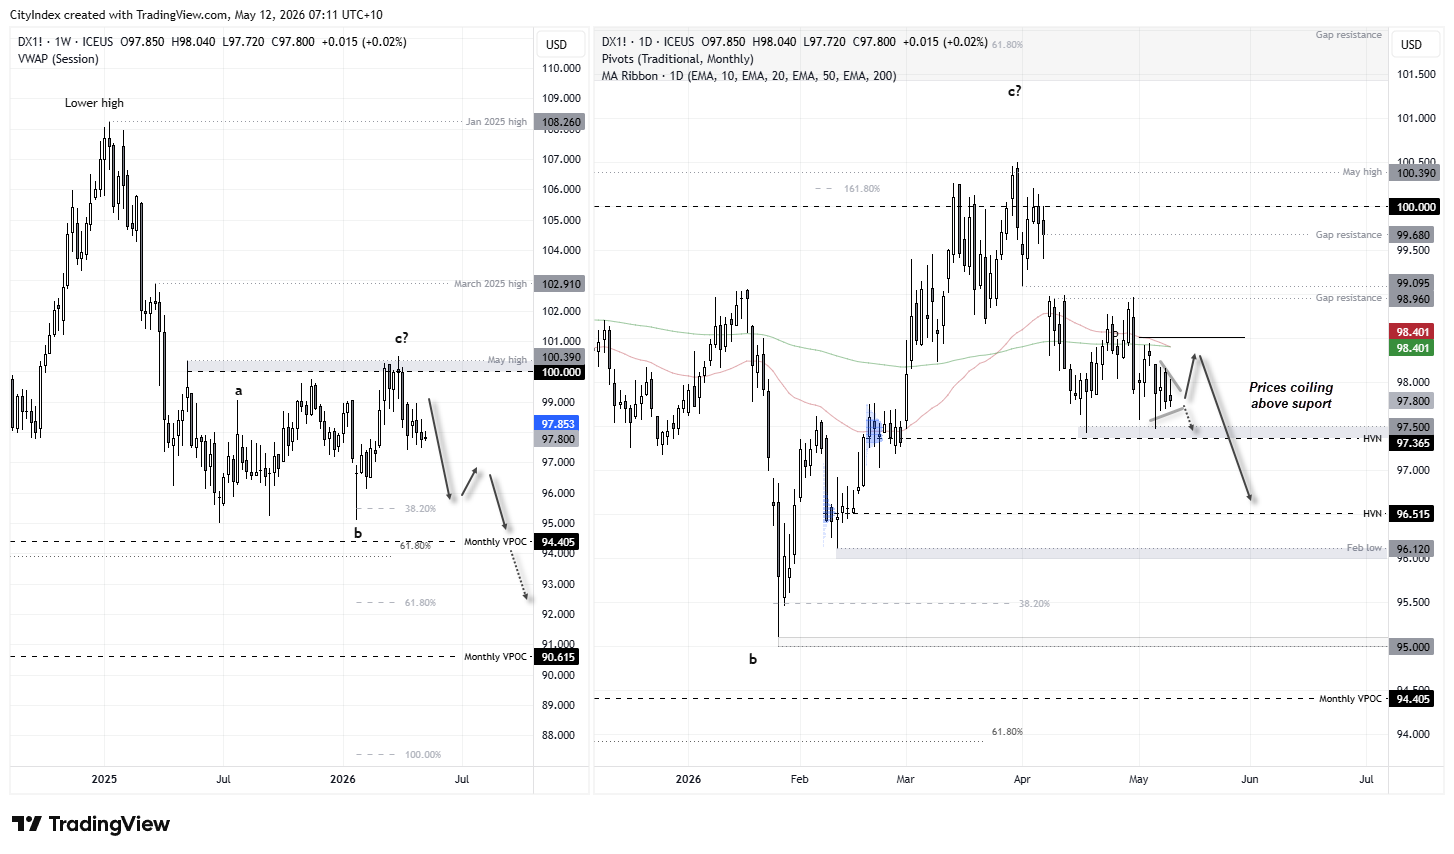
Source: ICE, TradingView
USD/JPY Technical Analysis: US Dollar vs Japanese Yen
I outlined in my previous two Japanese yen articles that currency intervention from thew MOF tends to coincide with meaningful tops on USD/JPY – spanning weeks to months. Given my bearish USD predisposition, I’m happy to assume USD/JPY saw a significant top on April 30. The -5.1% (152.52) and -7.8% (148.19) labels on the weekly chart represent post-intervention declines of the two smaller selloffs on USD/JPY.
Yet momentum is curling higher with Monday’s bullish engulfing candle, which could temp bulls to drive it back towards the 158 handle. Though note that monthly pivot point (157.62) and 157.54 swing lows nearby to which could provide a resistance zone for bears to fade into.
And should a swing high form at or around 158 as I anticipated, bears could then seek to drive USD/JPY back towards the 200-day EMA and below.
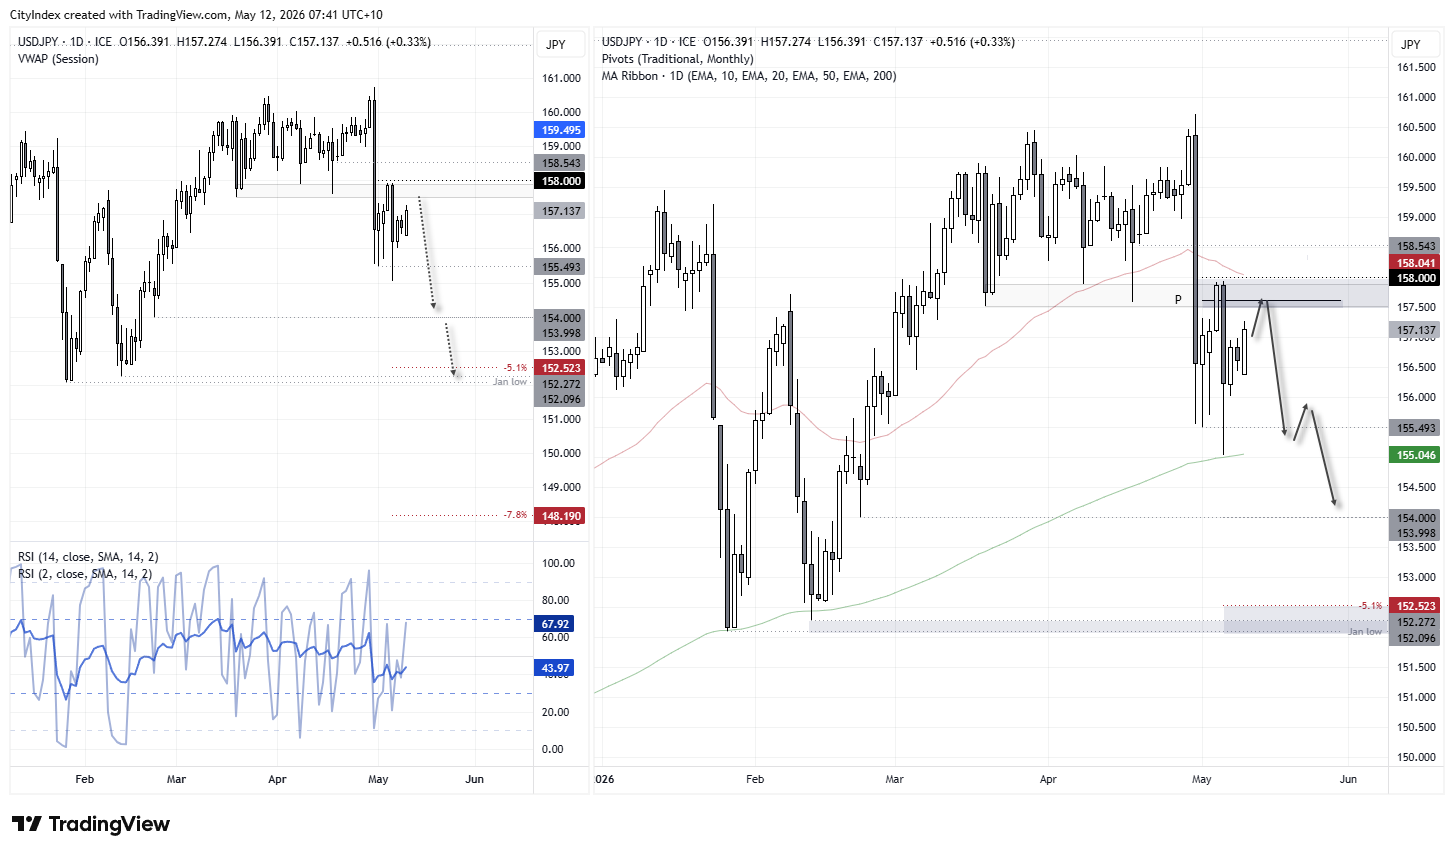
Source: ICE, TradingView
View the full economic calendar
-- Written by Matt Simpson
Follow Matt on Twitter @cLeverEdge
How to trade with City Index
You can trade with City Index by following these four easy steps:
- Open an account, or log in if you’re already a customer
• Open an account in the UK
• Open an account in Australia
• Open an account in Singapore
- Search for the market you want to trade in our award-winning platform
- Choose your position and size, and your stop and limit levels
- Place the trade