
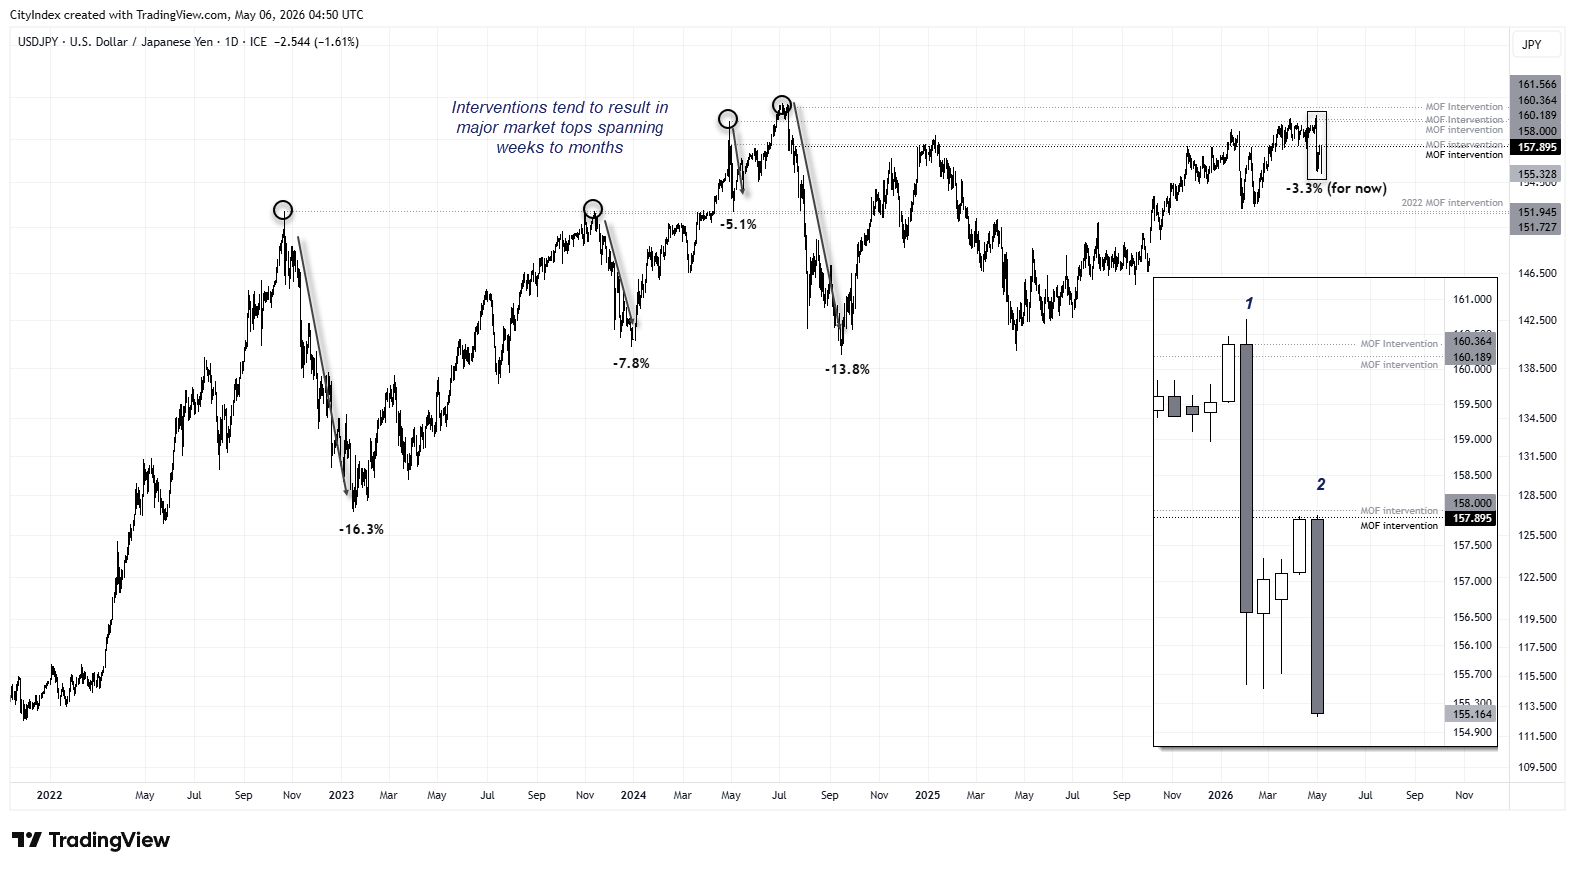
While we’re yet to receive official confirmation of intervention from Japan’s Ministry of Finance (MOF), the price action strongly suggests it occurred, once again. A series of verbal warnings from officials, a rising USD/JPY, and increasingly bearish yen positioning in futures markets set the stage—while thin holiday liquidity provided the ideal conditions for a sharp reversal.
USD/JPY is now down around 200 pips (-1.3%) after its three-day rally stalled just shy of 158. I flagged that resistance zone in this morning’s report, and moves like this make you wonder whether the MOF pays attention to technical levels—because it played out almost perfectly.
View related analysis:
- Japanese Yen Weakens: USD/JPY Outlook as EUR/JPY and AUD/JPY Diverge
- Japanese Yen Intervention: Volatility Fades, But Turning Points Emerge
- FX Futures Positioning: USD, USD/JPY, GBP/USD, AUD/USD | COT Report
- Gold and Silver Outlook: Bearish Reversals Signal Further Downside
USD/JPY Falls from 158 as Yen Surges on Suspected MOF Intervention
Yen Intervention Signals Potential USD/JPY Top
It is worth noting that yen intervention has historically aligned with meaningful tops in USD/JPY, often lasting weeks to months. The 2022 peak saw USD/JPY fall -16.3%, while the 2024 top delivered a -13.8% decline. Even the smallest move of -5.1% exceeds the current pullback of around -3.3% from the cycle high.
With Europe and the US yet to fully react—and the US dollar already under pressure following the latest ‘peace deal’ headlines—it may take time before USD/JPY makes another attempt at 158.
Source: ICE, TradingView

Yen Leads Broad FX Moves as Volatility Spikes
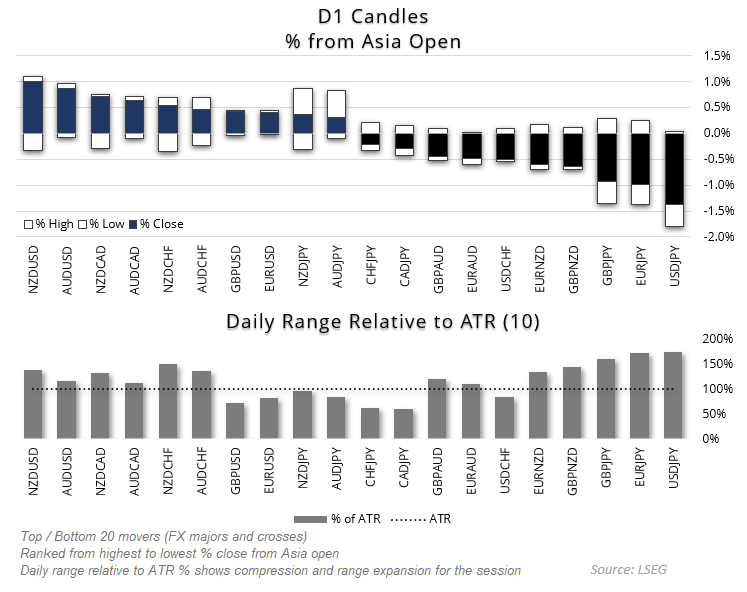
The Japanese yen is the strongest major this session, with USD/JPY, EUR/JPY and GBP/JPY leading declines by % move. Notably, several FX majors have already exceeded their average daily range—something rarely seen during the Asian session.
This suggests aggressive repricing rather than a gradual move. With multiple pairs pushing beyond 100% of their 10-day ATR, volatility is clearly expanding, raising the risk of further follow-through as European and US traders react.
Source: LSEG
USD/JPY Technical Analysis: US Dollar vs Japanese Yen
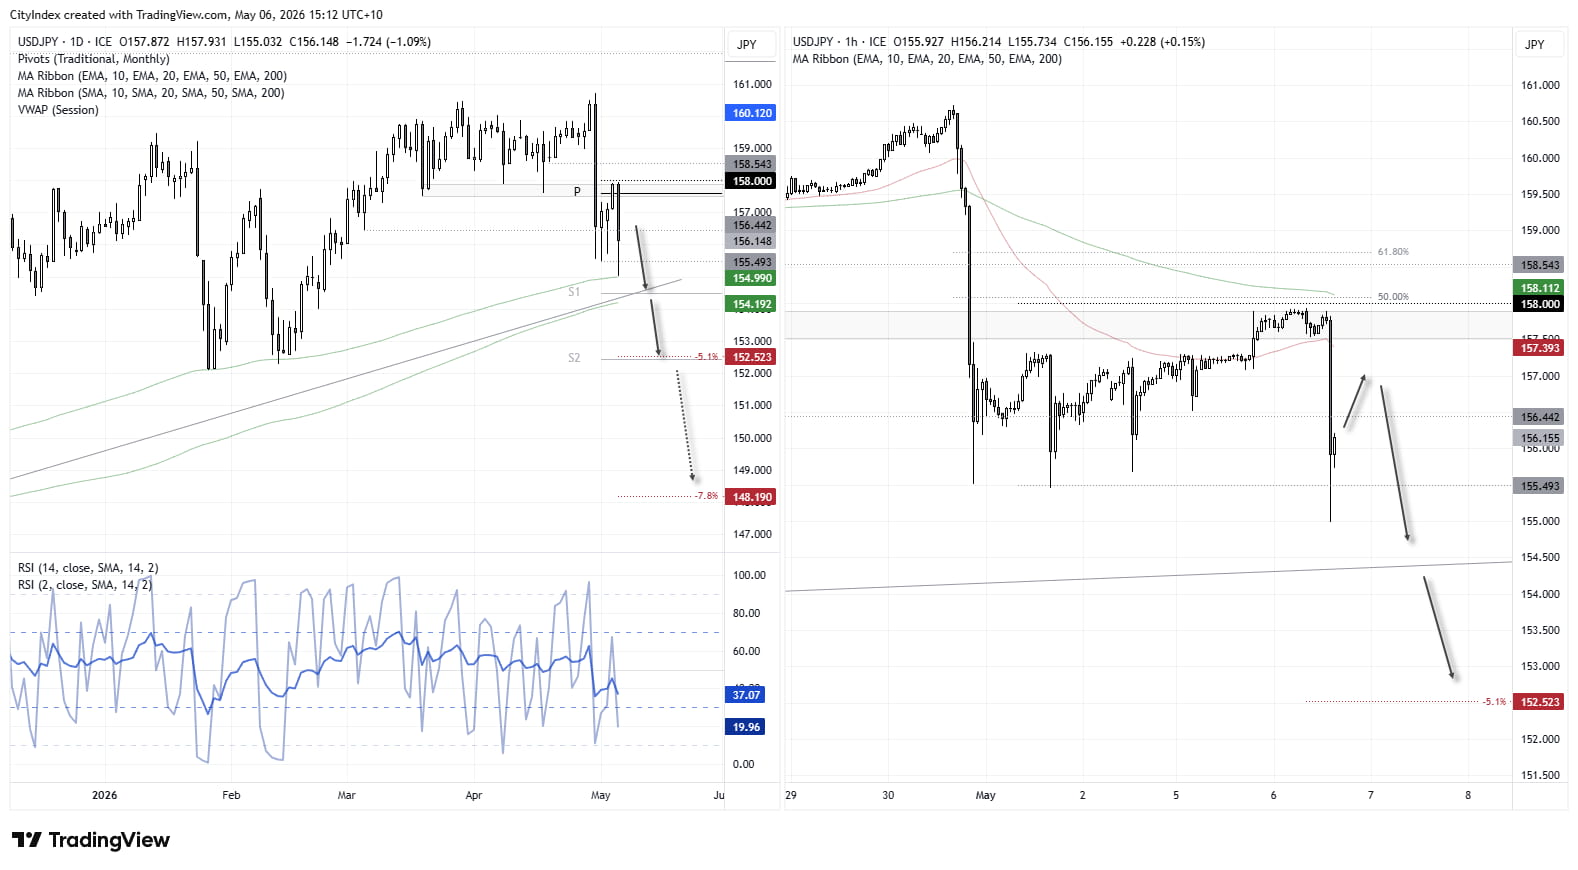
The daily chart shows USD/JPY is on track for a bearish outside day, though support has been found at its 200-day EMA for now. Given we have already seen it recoup over a third of the alleged intervention losses in the past hour, perhaps it can retrace a little higher from here. But with the powers that be not happy with yen strength, USD/JPY bears may be looking to re-enter once the dust settles.
156.50 and 157 make potential areas for them to fade into in anticipation of a retest of trend support near the 200-day SMA. Bu for reference, a -5.1% decline – the minimum seen in recent interventions – could see USD/JPY fall to the monthly S2 pivot just above the 152 handle.
Source: LSEG
View the full economic calendar
-- Written by Matt Simpson
Follow Matt on Twitter @cLeverEdge
How to trade with City Index
You can trade with City Index by following these four easy steps:
- Open an account, or log in if you’re already a customer
• Open an account in the UK
• Open an account in Australia
• Open an account in Singapore
- Search for the market you want to trade in our award-winning platform
- Choose your position and size, and your stop and limit levels
- Place the trade