



The US dollar posted its strongest 2-day rally in six weeks following the US CPI report, although fading momentum across several FX majors suggests the rebound may soon pause. Still, historically bullish May seasonality for the DXY keeps the prospect of another push towards 99 alive.
The 0.6% rise in the US dollar index over the past two days marks its best 2-day streak in six weeks. But the rally could have been stronger, given around half of Wednesday’s gains were handed back before the US close. And with USD/JPY and USD/CAD stalling near resistance while EUR/USD holds above support, there is a technical case that the US dollar rebound may need to pause for breath — or pull back slightly over the near term.
View related analysis:
- How to Read the COT Report to Track Forex Market Sentiment
- US Dollar Outlook: Bullish May Seasonality Meets Volatility Risk
- Japanese Yen Outlook: USD/JPY Eyes 158 Pivot, AUD/JPY and GBP/JPY in Focus
- VIX Breakout Flashes Warning Signal for Wall Street
- US Dollar Coiling, USD/JPY Eyes Resistance Heading into US CPI
DXY Rally Loses Momentum, Though May Seasonality Remains Bullish
US Dollar Index (DXY) Technical Analysis
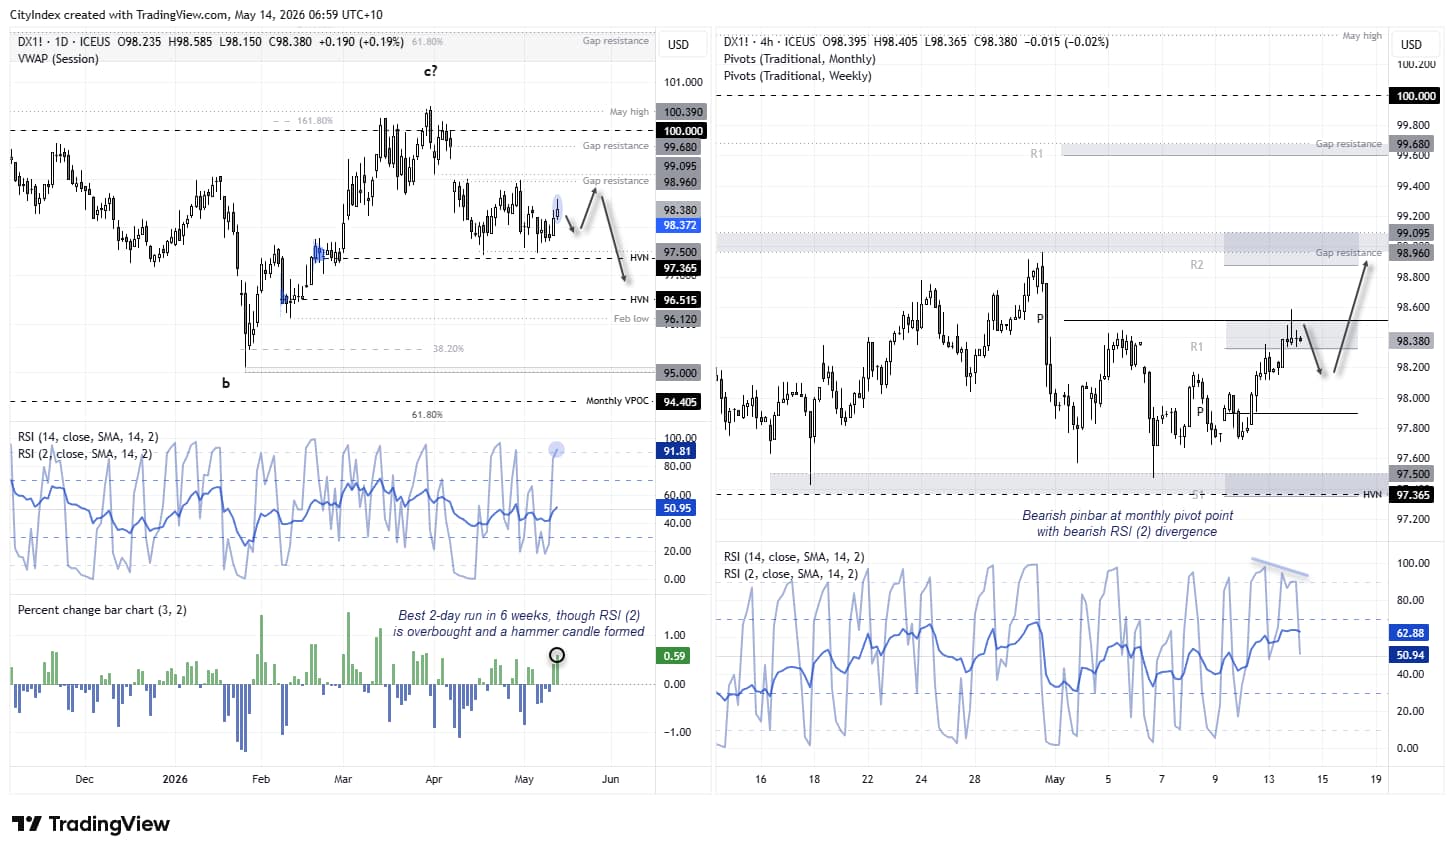
The daily chart shows Tuesday’s US CPI report resulted in a decent bullish range expansion candle. That aligned well with my bias earlier in the week, as I had noted the coiling nature of price action near cycle lows above support. However, Wednesday’s inverted hammer points to a loss of momentum from US dollar bulls around 98.50.
With the daily RSI (2) now overbought, traders should be on guard for at least a minor pullback. A prominent shooting star candle has formed on the 4-hour chart around the monthly pivot point, while bearish divergence has emerged on the RSI (2) on the same timeframe.
The best chance of the US dollar rolling over would likely come from headlines suggesting the US and Iran have reached a peace deal. That could weaken momentum sufficiently for traders to reconsider a break beneath the 97.35–97.50 support zone.
For now, the bias is for a minor pullback before another attempt higher towards 99, although my preference is for that level to hold as resistance.
Source: ICE, TradingView

DXY Seasonal Trends Favour Further Gains in May
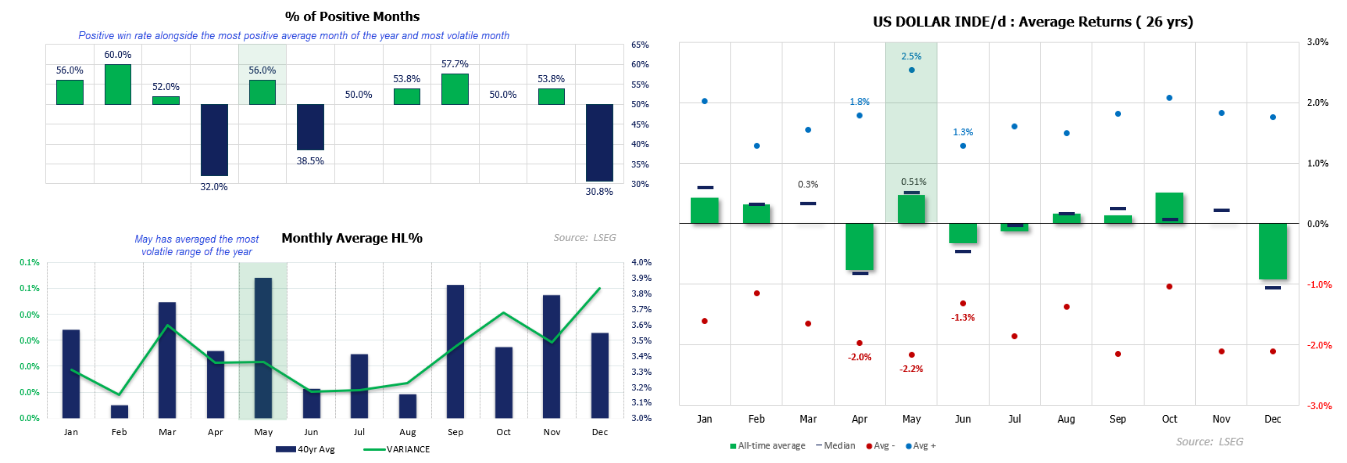
Now seems as good a time as any to remind ourselves that May tends to generate positive returns for the US dollar index. Over the past 26 years, the DXY has posted average and median returns of around 0.5%, closed higher 56% of the time, and, during those bullish months, averaged a gain of 2.5%.
Moreover, May has historically been the most bullish month of the year, with an average high-to-low range just shy of 4%.
Should seasonality play out once again, a 2.5% rally from May’s low would place the index just beneath 100. I cannot say I am that bullish on the US dollar, but it may mean a move back towards 99 is more likely than some expect.
Source: ICE, LSEG
FX Majors Hint at Near-Term US Dollar Pullback
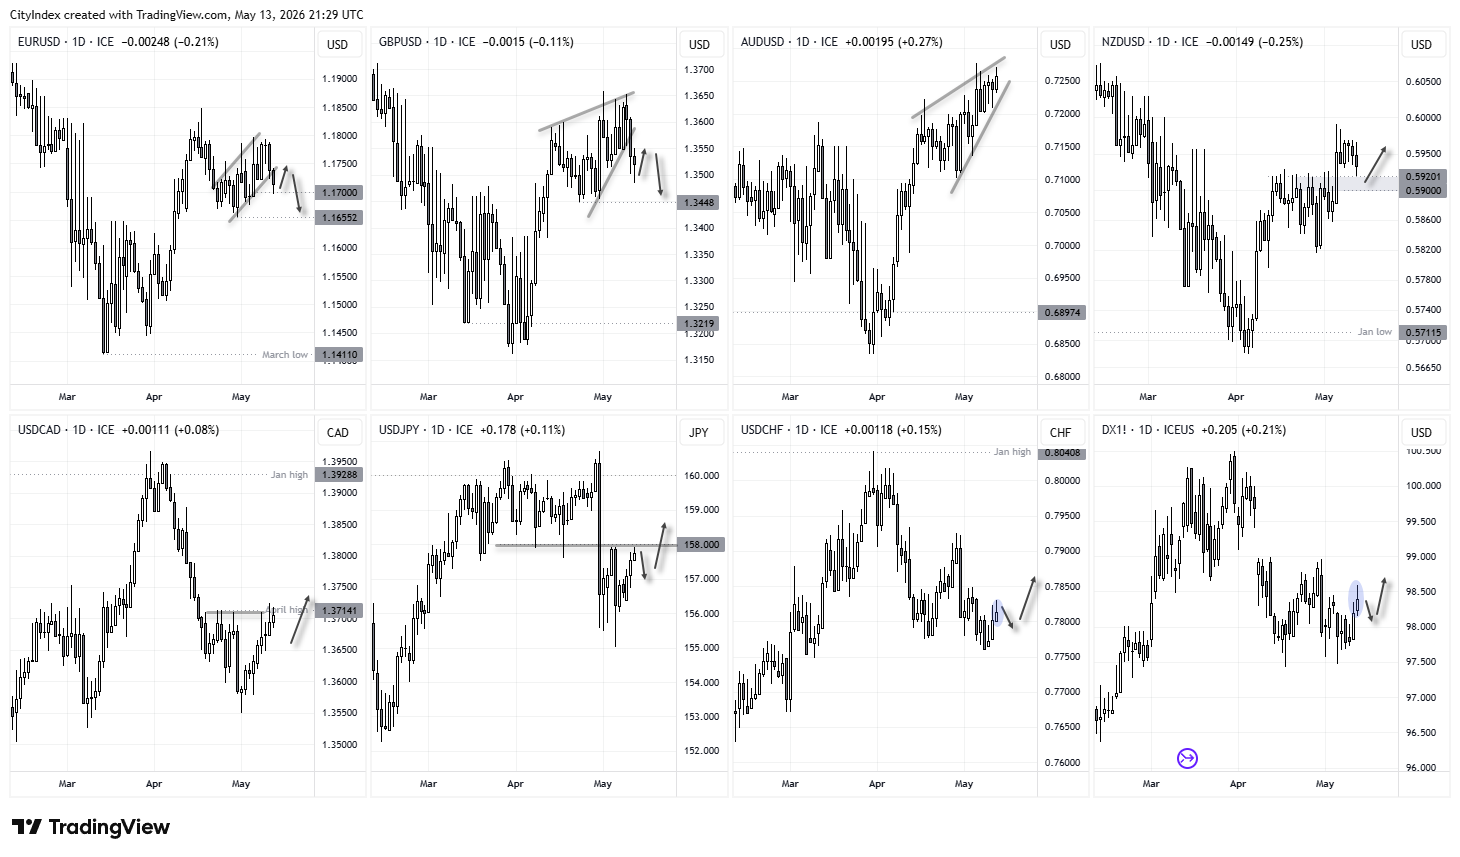
FX majors are showing mixed signals following the US CPI-fuelled rebound in the dollar. While some USD pairs remain supported, several key technical levels suggest the rally may be losing momentum over the near term.
EUR/USD:
Support emerged around 1.17 on Wednesday, and with the euro accounting for 57% of the US dollar index, even a modest rebound here could send the dollar slightly lower over the near term. That said, EUR/USD has broken below a rising channel, which paints a more bearish picture further out — to the potential benefit of the US dollar.
GBP/USD:
Bearish momentum has seen the British pound break down from a rising wedge, which for now points towards a retest of the cycle lows around 1.1350. However, Wednesday’s smaller range and lower wick warn that bearish momentum may be fading over the near term.

USD/JPY:
A third consecutive day higher, though traders are clearly wary of the 158 level given Japan’s Ministry of Finance likely intervened around these levels last week. That makes it a suitable area for at least a minor retracement.
USD/CHF:
The Swiss franc continues to track the US dollar index closely, so the shooting star candle formed on Wednesday fits with my bias for a minor pullback in the US dollar.
USD/CAD:
A 2-bar bullish reversal week suggests further gains may await. However, the upper wick near resistance on Tuesday and Wednesday’s small inside day show this FX major is also hesitant to extend gains over the near term.
AUD/USD:
Choppy price action on the daily timeframe alongside converging highs and lows shows a classic rising wedge pattern near cycle highs. Perhaps an unpopular view given the Australian dollar’s strength elsewhere, but it remains a bearish reversal pattern while the Aussie struggles to break above 0.7730.
NZD/USD:
The New Zealand dollar appears best placed to take advantage of a weaker US dollar, with NZD/USD holding above prior highs and the 0.59 handle.
Source: ICE, TradingView
View the full economic calendar
-- Written by Matt Simpson
Follow Matt on Twitter @cLeverEdge
How to trade with City Index
You can trade with City Index by following these four easy steps:
- Open an account, or log in if you’re already a customer
• Open an account in the UK
• Open an account in Australia
• Open an account in Singapore
- Search for the market you want to trade in our award-winning platform
- Choose your position and size, and your stop and limit levels
- Place the trade






