



The Australian dollar came under renewed pressure on Wednesday as softer Australian inflation data and a hawkish RBNZ decision combined to weigh heavily on AUD crosses. AUD/USD is showing signs of a deeper ABC-style correction below 71c, while AUD/NZD posted its most bearish session in nine years to strengthen the broader bearish case for the Aussie. Meanwhile, EUR/AUD remains constructive above VWAP support and GBP/AUD is attempting to carve out a bullish reversal from a key support zone.
View related analysis:
- British Pound Outlook: GBP/USD, GBP/AUD Tease Bears, EUR/GBP Rebounds
- US Dollar Retreats on Iran Peace Deal Hopes, Though AUD/USD Bears Eye 70c
- FX Futures Positioning: Dollar Rebound Stalls as Yen Bears Return | COT Report
- How to Read the COT Report to Track Forex Market Sentiment
AUD/USD Bear Case Builds as AUD/NZD Signals Top, GBP/AUD Eyes Rebound
AUD/USD Technical Analysis: Australian Dollar vs US Dollar
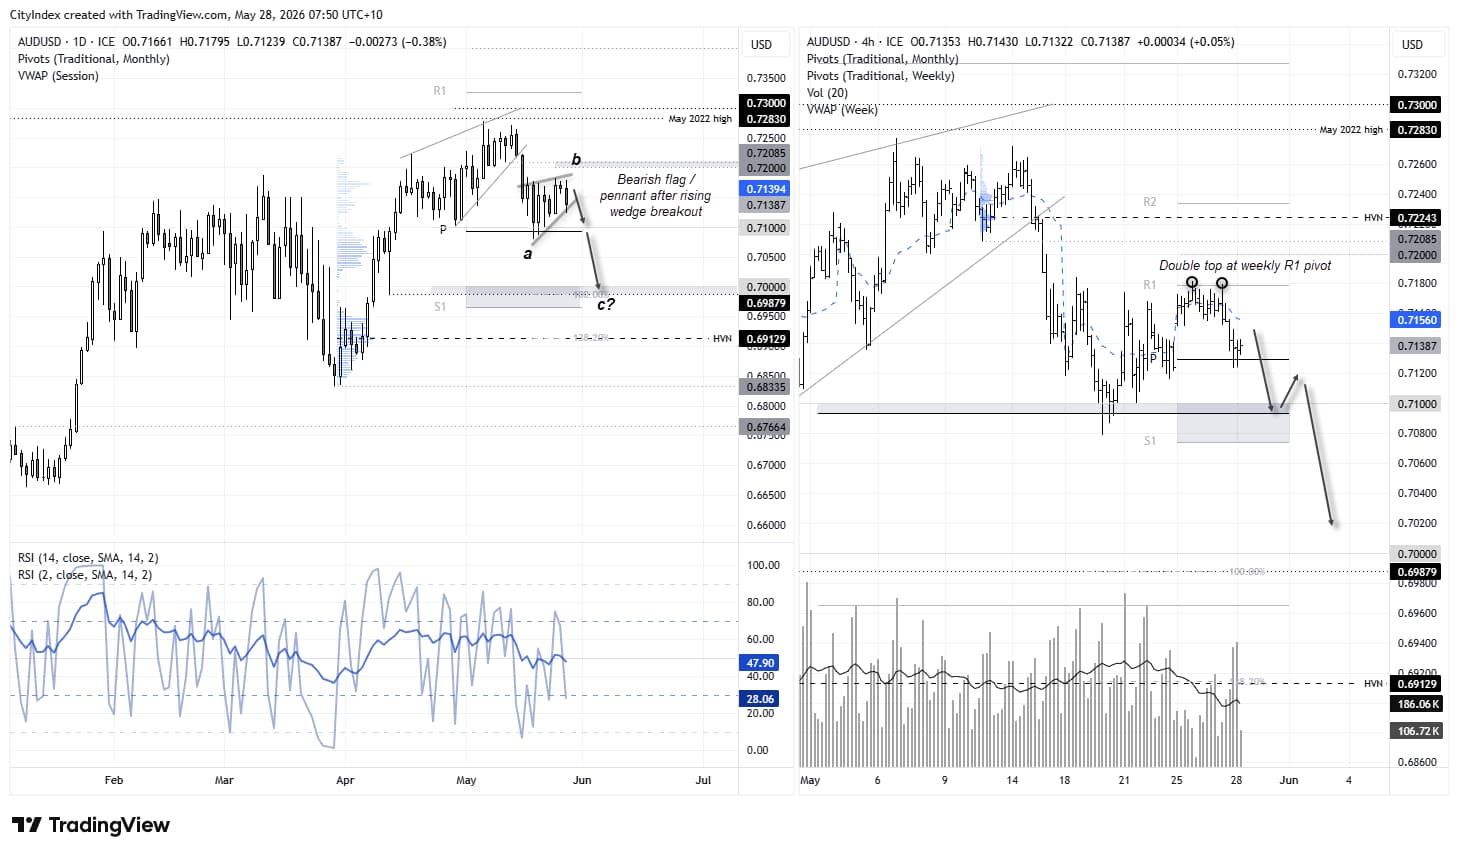
Momentum turned lower for AUD/USD on Wednesday, with the US dollar index holding key support and reinforcing my case for a swing high on the Aussie. I have outlined my bias for another leg lower towards 70c, pending a break below 71c, and yesterday’s price action appears constructive to that view. I suspect the initial drop towards 71c following the rising wedge breakout was the first wave of an ABC correction. And unless the Australian dollar rips higher from here, Tuesday’s high may have marked wave B, with wave C already underway.
Incidentally, a 100% projection of wave A from the wave B high lands just beneath 70c, which would satisfy a classic ‘wave equality’ ABC pattern. Given Australia’s monthly CPI report has cast further doubt over the prospect of an RBA hike in June, I believe the case for another leg lower in AUD/USD remains intact — especially when we factor in price action on AUD/NZD.
Source: ICE, TradingView

AUD/NZD Technical Analysis: Australian Dollar vs New Zealand Dollar
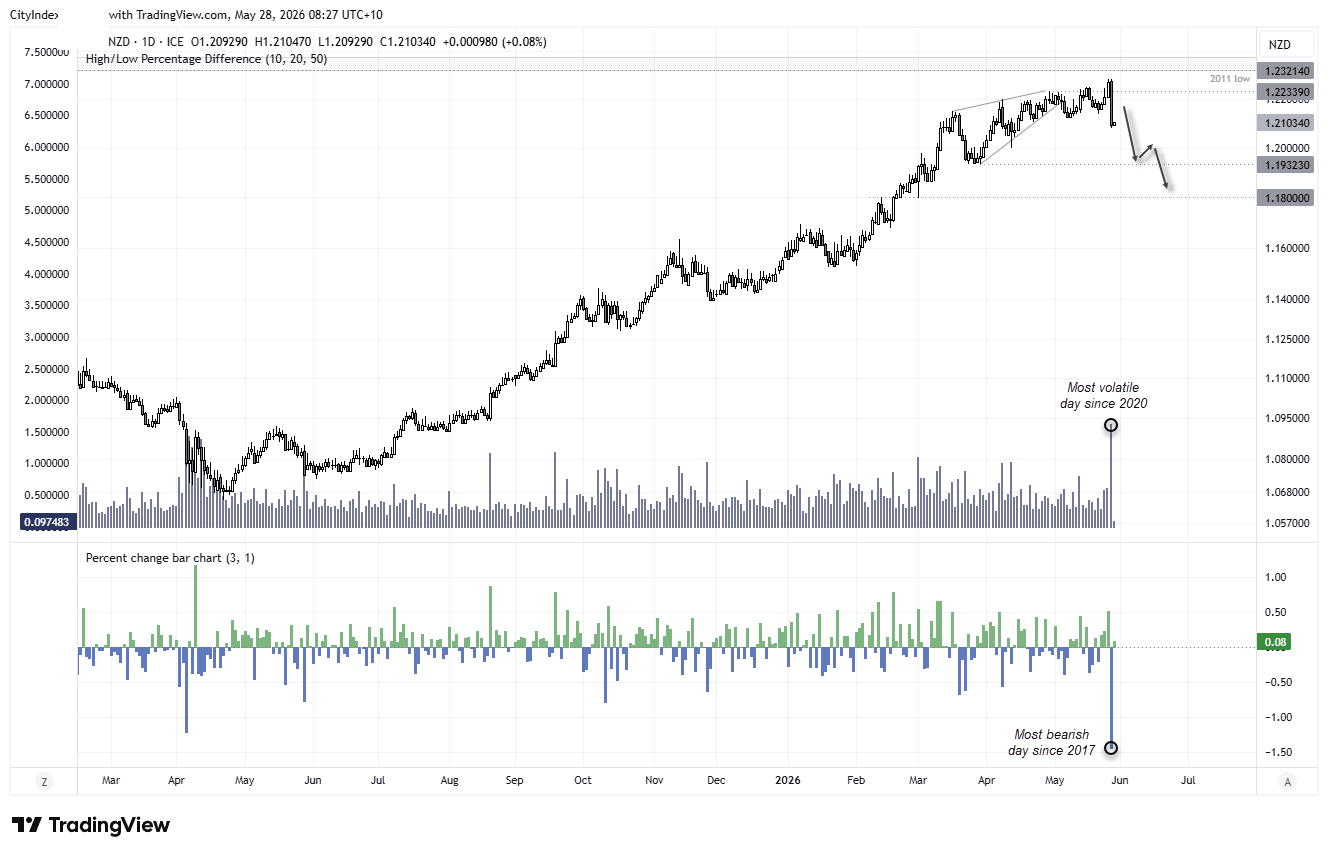
The RBNZ surprised markets with a hawkish hold on Wednesday, which, when combined with an inflation report that cast further doubt over an RBA hike in June, resulted in a notably bearish session for AUD/NZD. In fact, it was the pair’s most volatile day since 2020 and its most bearish daily session in nine years.
This strongly suggests the top may finally be in place. I previously tried — and failed — to pick the top using a rising wedge pattern, which clearly did not play out as expected. However, the false break above recent highs beneath the 2011 lows now points to a more convincing top formation. It also adds weight to the broader bearish case for the Australian dollar in general.
For now, my preference is for rallies to be faded, with AUD/NZD potentially heading towards 1.20 and the rising wedge low at 1.1932. A break beneath that level could then bring 1.18 into focus.
Source: ICE, TradingView
EUR/AUD Technical Analysis: Euro vs Australian Dollar
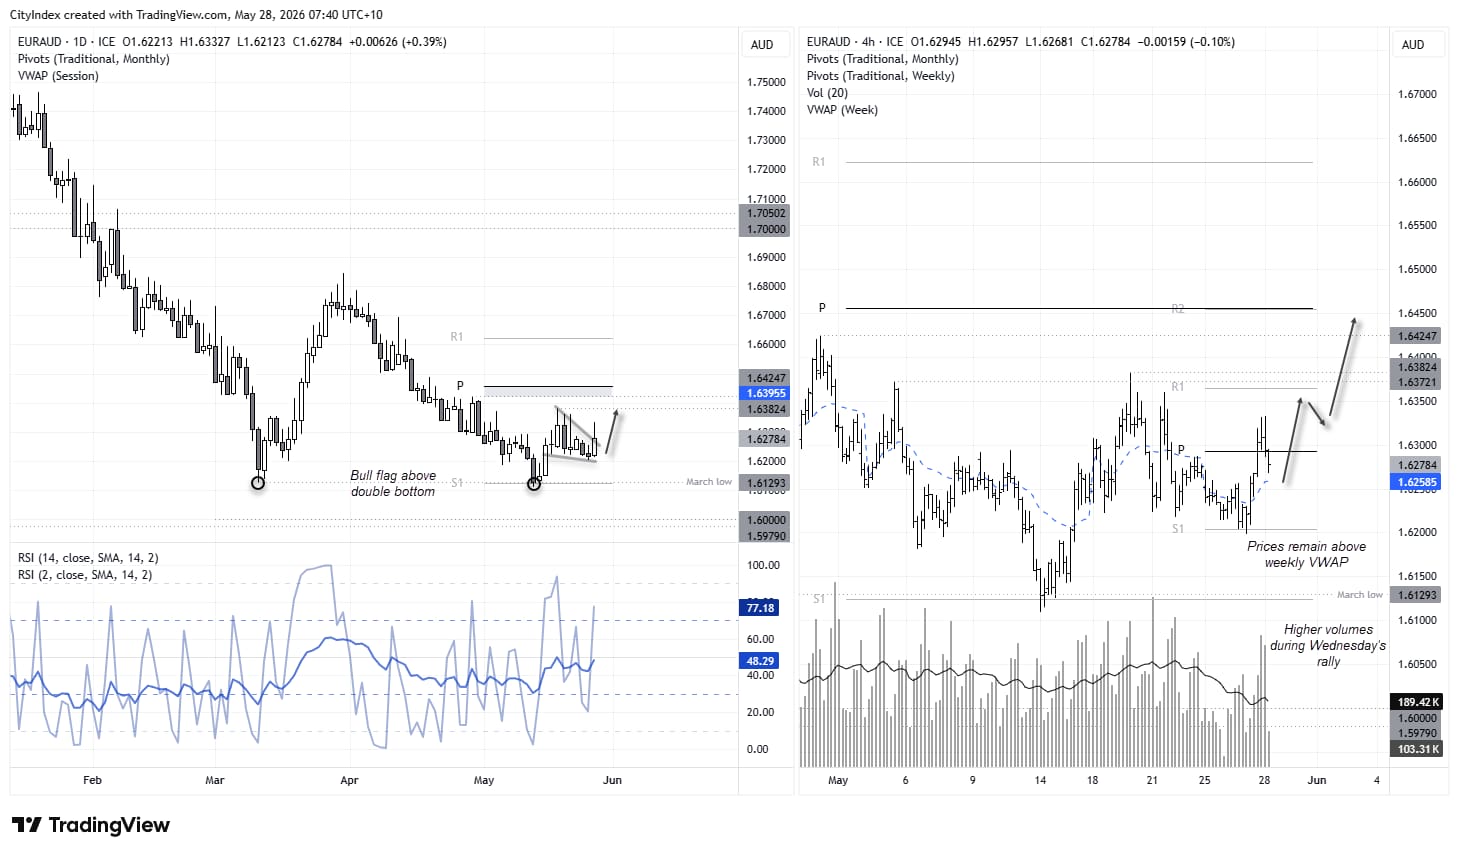
My sneaking suspicion that EUR/AUD was gearing up for another leg higher has so far played out well, with the euro briefly touching a five-day high against the Australian dollar on Wednesday. The fact it later handed back around half of those gains before the US close is not necessarily detrimental to the near-term bullish outlook. If anything, it may help support the bullish case heading into today’s session.
The 4-hour chart shows EUR/AUD remains above its weekly volume-weighted average price (VWAP), suggesting demand remains constructive over the near term. Bulls could seek evidence of a swing low above yesterday’s low, near the 1.62 handle and S1 pivot point. The bias remains for a move towards at least the weekly R1 pivot at 1.6356. A break above the 1.6382 swing high could then expose the monthly pivot point and weekly R2 near 1.6454.
Source: ICE, TradingView

GBP/AUD Technical Analysis: British Pound vs Australian Dollar
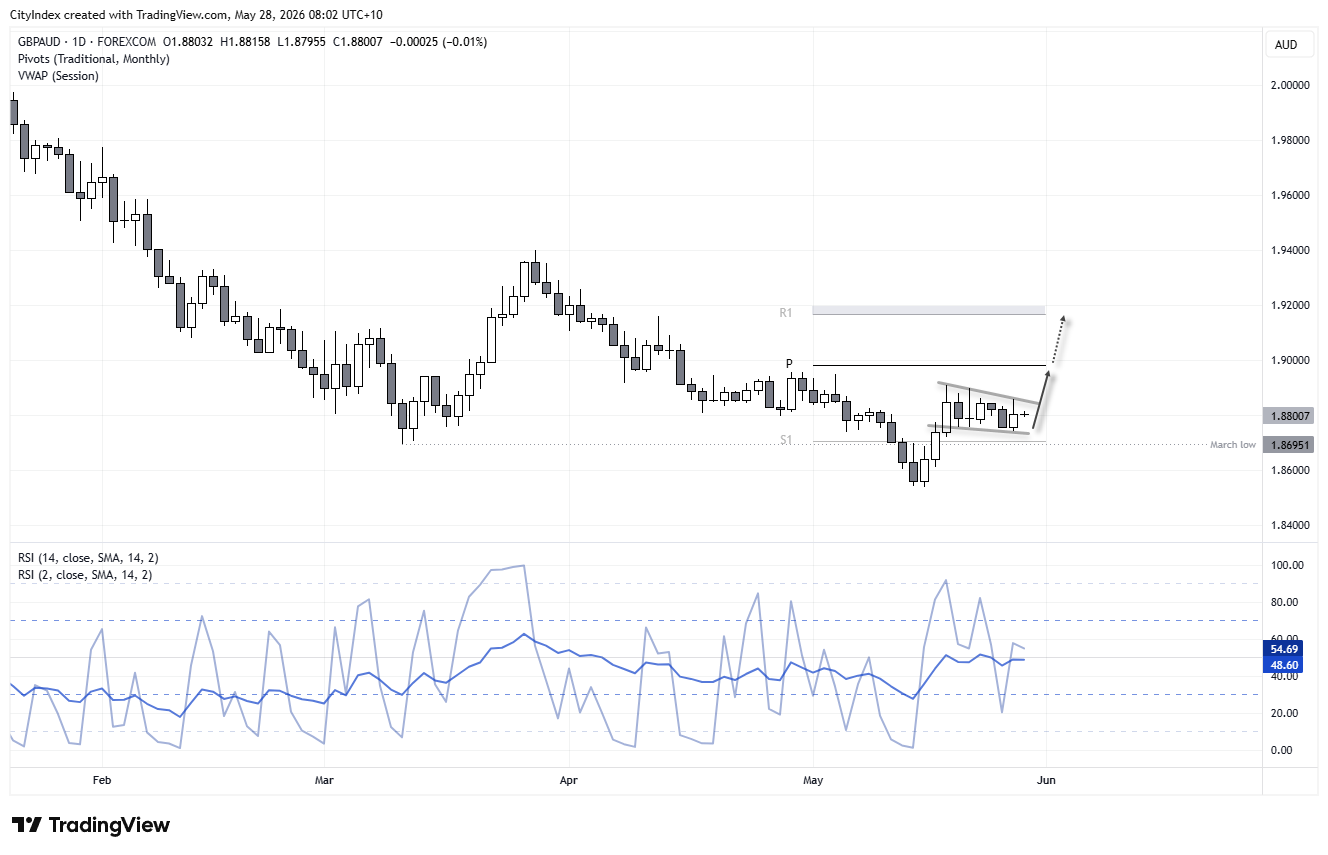
A similar setup is emerging on GBP/AUD, with a potential bull flag forming on the daily chart. In this instance, however, British pound bulls also have the monthly S1 pivot and March low nearby as an added layer of support, which could make retracements towards that zone attractive for dip buyers. That said, a bullish outside day and inverted hammer formed on Wednesday, highlighting demand above this tight support zone. Therefore, a move back towards the 1.90 handle and monthly pivot point could arrive sooner rather than later.
Source: ICE, TradingView
View the full economic calendar
-- Written by Matt Simpson
Follow Matt on Twitter @cLeverEdge
How to trade with City Index
You can trade with City Index by following these four easy steps:
- Open an account, or log in if you’re already a customer
• Open an account in the UK
• Open an account in Australia
• Open an account in Singapore
- Search for the market you want to trade in our award-winning platform
- Choose your position and size, and your stop and limit levels
- Place the trade






