



The British pound is showing mixed technical signals across major FX pairs, with GBP/USD stalling beneath 1.3500 while GBP/AUD and EUR/GBP test important support zones. Although sterling has managed to stabilise against the US dollar and Australian dollar in recent sessions, momentum studies and reversal patterns suggest traders may soon face key directional decisions.
In today’s analysis, I look at the technical outlook for GBP/USD, GBP/AUD and EUR/GBP, including bearish reversal patterns, potential countertrend rebounds and the support and resistance levels likely to shape sterling price action over the coming sessions.
View related analysis:
- US Dollar Retreats on Iran Peace Deal Hopes, Though AUD/USD Bears Eye 70c
- FX Futures Positioning: Dollar Rebound Stalls as Yen Bears Return | COT Report
- Australian Dollar Outlook: Yield Spreads Hint at Downside Break for AUD/USD
- How to Read the COT Report to Track Forex Market Sentiment
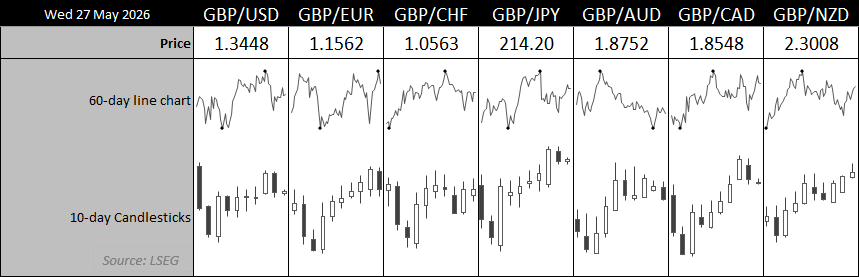
Source: LSEG
British Pound Technical Outlook Across GBP/USD, GBP/AUD and EUR/GBP
GBP/USD Technical Analysis: British Pound vs US Dollar
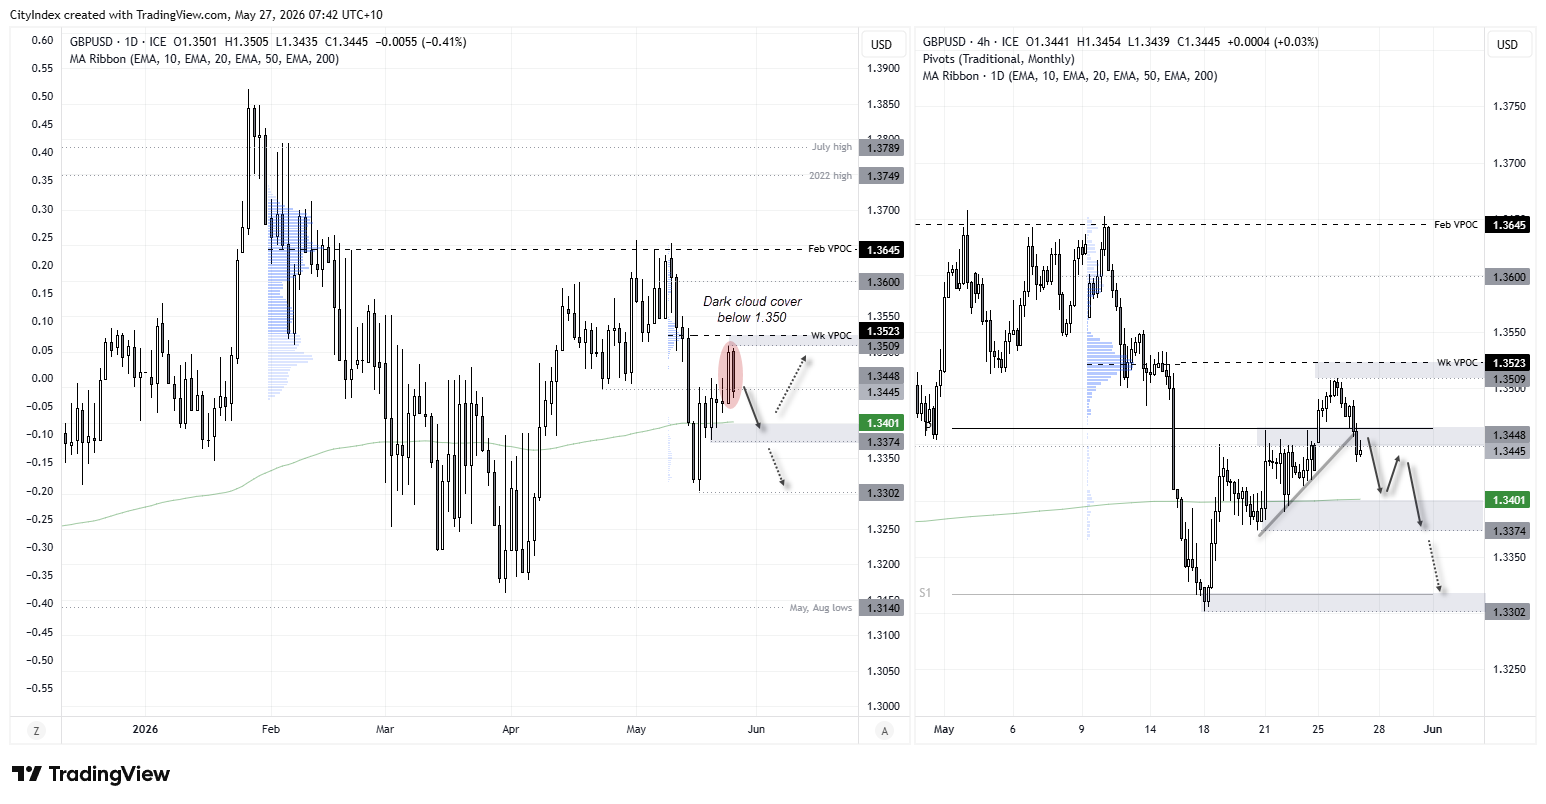
We’ve seen a decent rebound from GBP/USD bulls up to Monday’s high, with the British pound recouping around half the losses from the decline off the May high. Yet Tuesday’s bearish candle helped form a classic two-bar reversal pattern known as a dark cloud cover, just below 1.3500 and a weekly volume point of control (VPOC).

GBP/USD Bears Eye Pullback to 200-Day EMA
In isolation, this could hint at a swing high and bears may well be licking their lips. However, I suspect upside potential for the US dollar index could be limited from here, and with GBP/USD also holding above its 200-day EMA near 1.3400, the downside may likewise prove limited.
The 4-hour chart shows prices have slipped back beneath the monthly pivot point with momentum turning lower. A move down towards the 200-day EMA at 1.3400 could now be on the cards, although we would also need to see a break beneath the 1.3374 low before assuming a larger decline towards the 1.3300 low and monthly S1 pivot is underway.
So while the downside appears favourable for bears, they may want to tread carefully and remain nimble.
Source: ICE, TradingView
GBP/AUD Technical Analysis: British Pound vs Australian Dollar
GBP/AUD Bears Retain Control, Though Bulls Eye Support
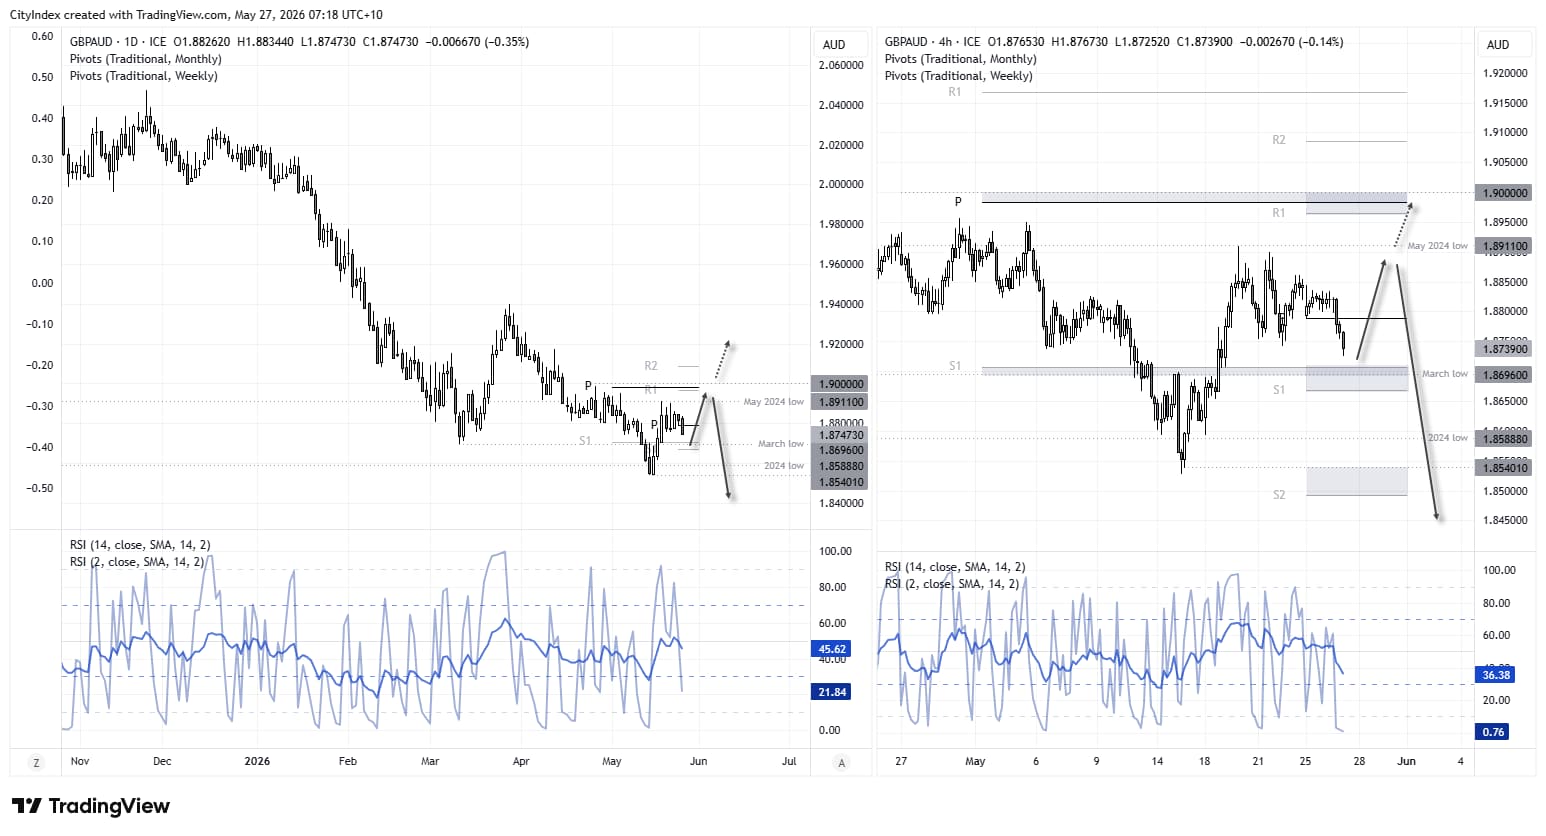
Given the British pound topped out against the Australian dollar just over a year ago and has since declined by 14.3%, it is fair to say GBP/AUD remains within an established downtrend. Momentum has also curled lower once more, suggesting bears have re-established control. Yet I remain reluctant to fully write off GBP/AUD just yet.
The May low saw a sharp bullish reversal and false break beneath the 2024 low, before price rallied back above the March high and probed the May 2024 low. I would not go as far as to call it a ‘V-bottom’ — which can mark a significant low — but I suspect pound bulls may still have more to give against the Aussie, especially as I also see scope for a deeper pullback in AUD/USD.
So while momentum has turned lower from a small consolidation pattern on the daily chart, I am waiting to see whether support can be established around the March low and monthly S1 pivot point, which reside just below 1.8700.
GBP/AUD Bulls Eye Countertrend Recovery Near Key Support
The 4-hour chart shows the weekly S1 pivot (1.8668) sitting nearby as an additional support level, so perhaps bulls can patiently wait for the current burst of bearish momentum to peter out. Ultimately, bulls could seek evidence of a swing low down towards the 2024 low on the assumption of a cheeky countertrend move back towards 1.9000 as part of a classic ABC correction for GBP/AUD.
That could then allow time for bears to fully regroup and extend the broader downtrend, potentially sending GBP/AUD to fresh lows thereafter.
Source: ICE, TradingView

EUR/GBP Technical Analysis: Euro vs British Pound
EUR/GBP Rebounds From Range Support
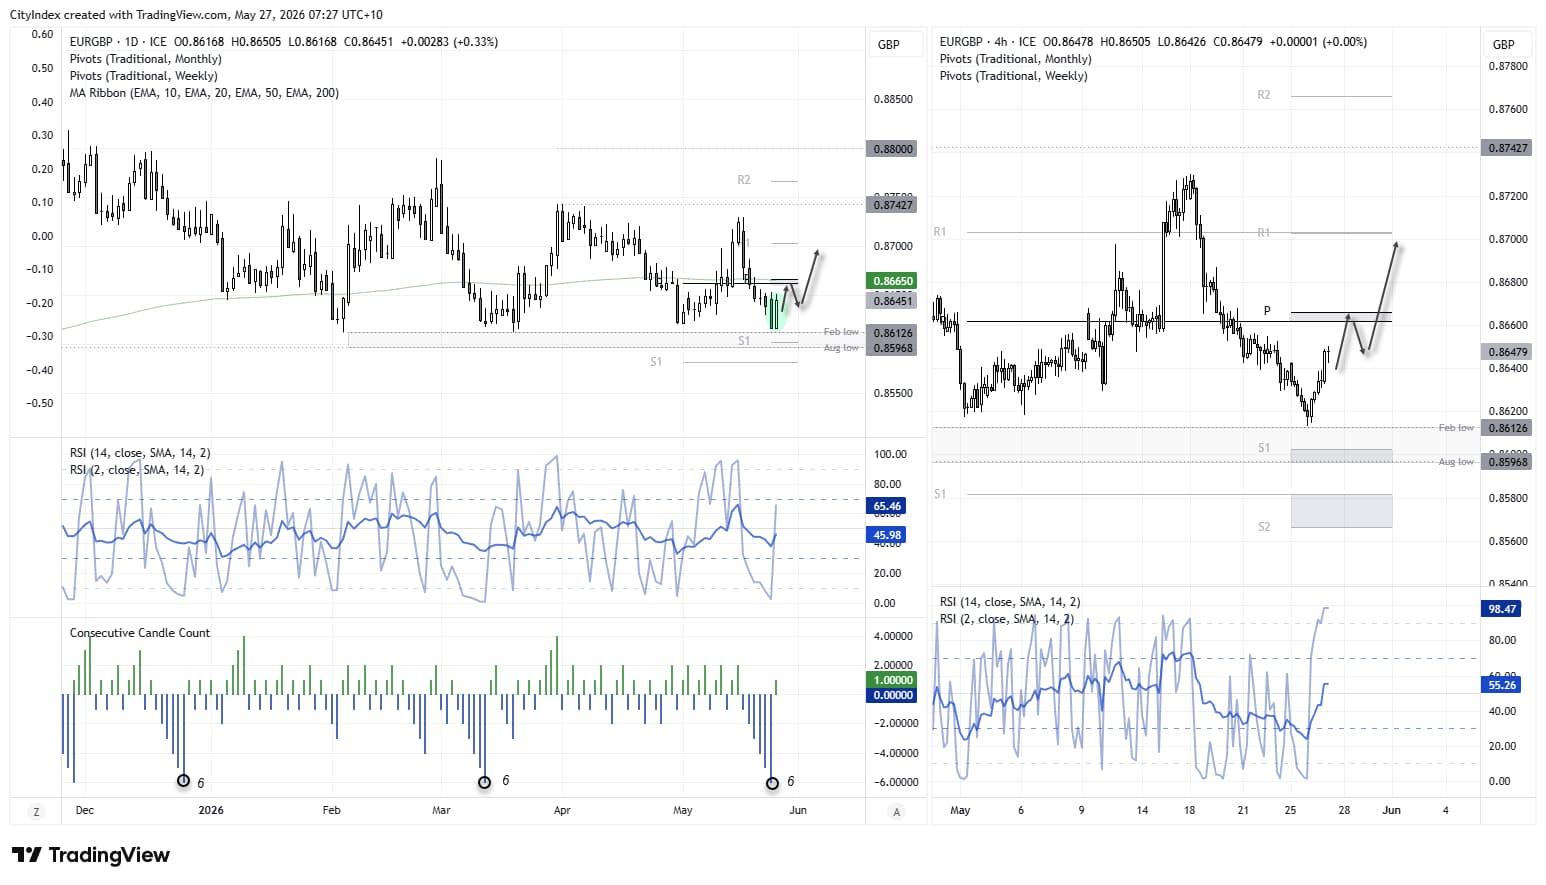
I made a video last week outlining my bias for a bullish rebound in EUR/GBP near its range lows. Tuesday’s bullish engulfing candle certainly makes a compelling case for a swing low, given it formed just above the February low following a six-day bearish streak. Furthermore, the daily RSI (2) was heavily oversold by Monday’s close, also hinting at a potential swing low for EUR/GBP.
What complicates the outlook for bulls is the resistance cluster around 0.8660, which includes the monthly and weekly pivot points alongside the 20-day EMA. Whether EUR/GBP can break above that zone remains to be seen, but momentum on the 4-hour chart suggests bulls could at least have a crack at it.
Given the resilience of support around 0.8600 this year, my bias for now is for a cheeky move towards the 20-day EMA, followed by a mild pullback and then another leg higher towards 0.8700 near the weekly R1 pivot point.
Source: ICE, TradingView
View the full economic calendar
-- Written by Matt Simpson
Follow Matt on Twitter @cLeverEdge
How to trade with City Index
You can trade with City Index by following these four easy steps:
- Open an account, or log in if you’re already a customer
• Open an account in the UK
• Open an account in Australia
• Open an account in Singapore
- Search for the market you want to trade in our award-winning platform
- Choose your position and size, and your stop and limit levels
- Place the trade






