
AUD/USD enters the week under pressure after weak Australian employment data crushed RBA hike expectations and widened the focus on US inflation and Treasury yields. While the Aussie dollar continues to hold above 71c for now, fading bullish momentum, softer labour market conditions and widening yield spreads suggest risks remain tilted towards another leg lower.
View related analysis:
- How to Read the COT Report to Track Forex Market Sentiment
- ASX 200 Outlook: Bulls Buy Dips as RBA Hike Bets Collapse
- Australian Dollar Outlook: AUD/USD Pullback Begins as Inflation Risks Rise
- Japanese Yen Outlook: USD/JPY Stalls While JPY Crosses Turn Choppy
Yield Spreads and Weak Jobs Data Keep AUD/USD Under Pressure
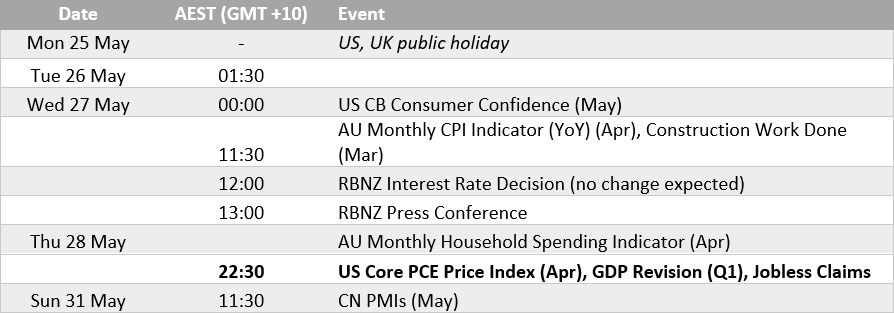
We’ll likely be off to a quiet start to the week given public holidays in the UK and US on Monday. Wednesday’s inflation report is the main domestic event for AUD/USD traders, though they’ll also keep a close eye on US CPI on Thursday. Otherwise, it’s a much shorter economic calendar than usual. And that could result in less volatility given traders seem to be taking much less notice of any updates surrounding the Us and Iran.
RBA Hike Bets Collapse as Weak Jobs Data Clouds CPI Impact
Odds of a June hike have fallen to just 4% following the latest employment report, with unemployment rising to a 4.5-year high of 4.5% and headline employment falling by 10k, driven by an 18k loss of full-time jobs. The unemployment rate may remain low relative to its long-term average, but it has been trending higher since October 2022 — and is now rising at a faster pace than the RBA anticipated.
Still, RBA cash rate futures have fully priced in a single 25bp hike by December, which could see the OCR reach 4.6% by Christmas.
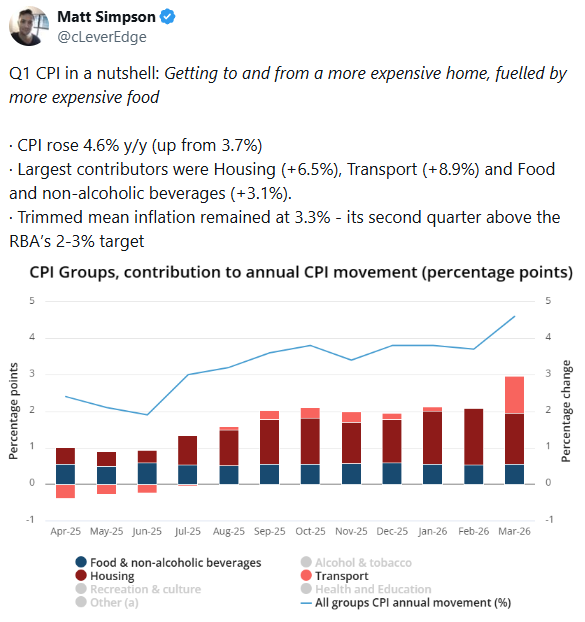
It also brings into question the relevance of Wednesday’s monthly CPI report. We know prices are likely to remain elevated over the near term due to inflationary pressures blowing in from the Middle East, although a weaker labour market gives the RBA more scope to remain cautious. While higher oil prices could bring forward the timing of a hike, it is debatable whether markets will reprice multiple hikes with cracks in the labour market already emerging. And with hotter prices expected, the bigger reaction from AUD/USD traders could be if inflation does not hear up as much as expected, leaving the Aussie vulnerable to another leg lower.

US Inflation Data Could Drive the Next AUD/USD Move
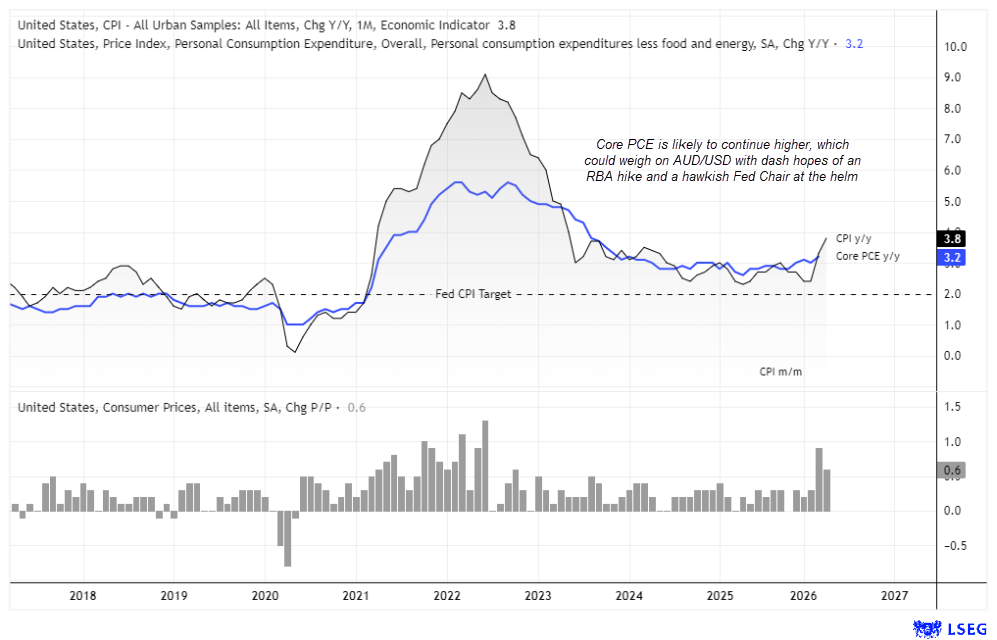
US inflation is the main data point of the week. And with Kevin Warsh now at the helm of the Fed, traders are likely to remain highly sensitive to any upside surprises in the inflation data. That could help retain my bias that the US dollar index is still trying to reach for 100 — even if I suspect the next leg higher may fall short of that target. Regardless, AUD/USD remains on my ‘fade the rally’ watchlist, with scope for a move back towards 70c in the coming weeks.
Source: BLS, LSEG
RBNZ Expected to Hold Rates While Hawkish Risks Linger
The RBNZ are widely expected to hold the cash rate at 2.25%, although policymakers may deliver another hawkish hold given their warning that persistent Middle East-driven inflation pressures could still warrant further tightening. The 1-year OIS rate sits at 2.9%, leaving a theoretical 65bp of tightening priced in for now — even if another hike this week remains unlikely.
Australian Dollar Performance
It was a mixed week for the Australian dollar, with the Aussie losing the most ground against the Swiss franc and British pound. It also ended lower against the US dollar and euro, held steady against the Japanese yen, and posted marginal gains against the Canadian dollar.
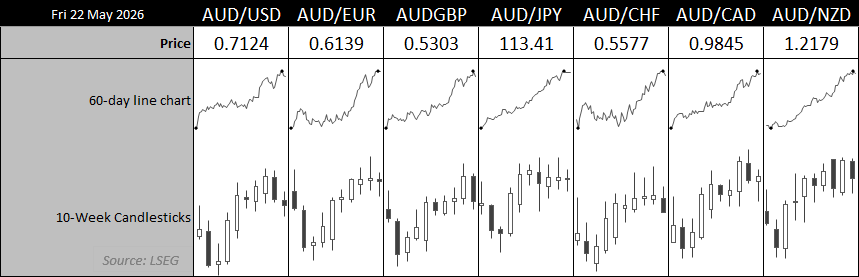
Chart prepared by Matt Simpson - Source: LSEG
- AUD/USD fell for a second consecutive week, although bearish momentum faded and the weekly doji candle suggests demand remains around 71c
- AUD/CAD found support at its February high and posted a marginal gain, although the weekly doji candle points to indecision at best
- AUD/CHF extended lower after printing a prominent shooting star candle at a 15-month high, hinting at a deeper pullback against the Swiss franc
- AUD/EUR found support at its 2025 high, although the weekly doji marks a third consecutive week with a relatively narrow open-to-close range
- AUD/GBP formed a bearish engulfing week, suggesting a pullback from its 29-month high may be underway
- AUD/JPY closed flat for a second consecutive week with another narrow range, highlighting a lack of conviction from either bulls or bears
- AUD/NZD continued to chop around 1.22 for a fourth straight week, further suggesting the broader bullish trend is in need of a pullback
AUD/USD Technical Analysis: Australian Dollar vs US Dollar
AUD/USD Correlations
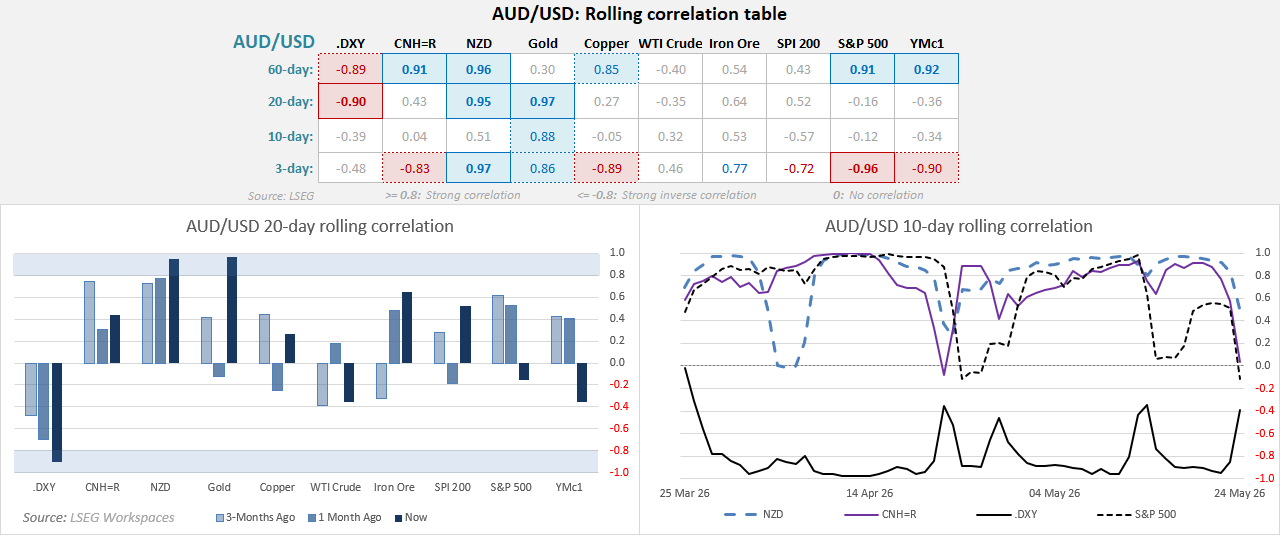
It’s not often that the classic AUD/USD correlation metrics converge towards zero, but that is exactly what we saw by Friday’s close. That ties in with the mixed price action seen across Australian dollar pairs last week. The geopolitical risk-on/risk-off narrative that helped drive strong correlations between AUD/USD, equities, commodities and the US dollar over recent months has faded, at least for now.
Correlations with markets such as the S&P 500, US dollar index (DXY), gold and China’s yuan have weakened notably on shorter timeframes, suggesting broader macro themes are no longer moving the Australian dollar in lockstep across markets.
Source: LSEG
AUD/USD Futures Positioning | COT Report
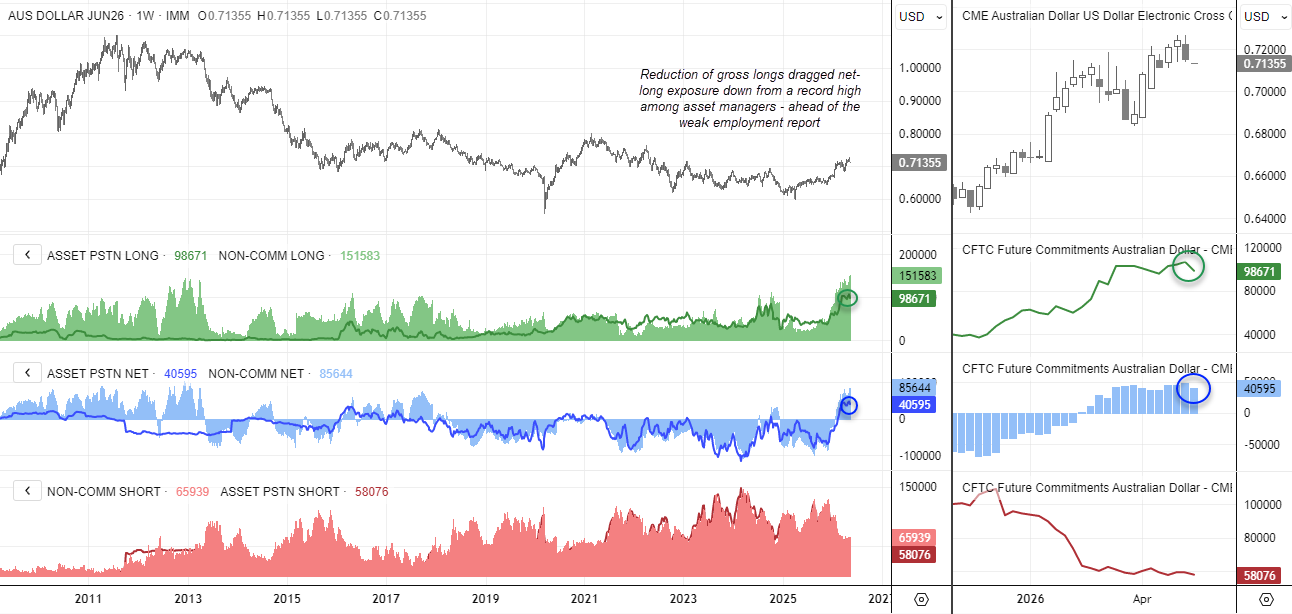
Asset managers reduced their net-long exposure by 6.9k contracts last week — the fastest pace of reduction since late November. It also pulled bullish exposure back from its latest record high. The fact this occurred ahead of the weak employment report and the collapse in RBA hike expectations suggests further bulls were shaken out during the second half of the week. Gross longs fell by 8.3k contracts, although shorts were also trimmed by 1.3k contracts.
Large speculators increased their net-long exposure slightly by 654 contracts, pushing positioning to a fresh 13-year high. However, asset managers are likely the more important group to follow when gauging broader sentiment towards AUD/USD futures.
Source: CFTC (COT) CME, LSEG

AUD/USD Options and Volatility Analysis (Risk Reversals, HVN Levels)
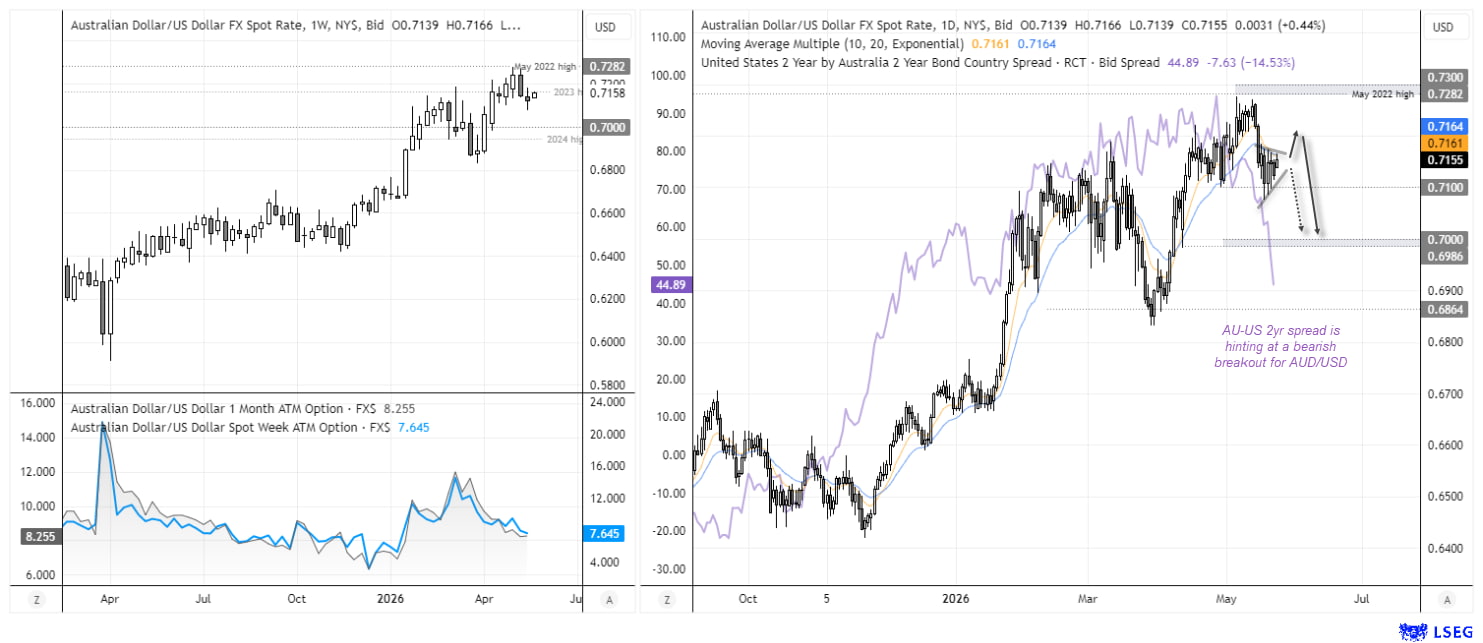
My view on the Australian dollar this week remains broadly in line with last week’s. I still suspect a move down towards 70c is on the cards, and therefore I’m looking for evidence of a swing high beneath the May high on the assumption of a break below 71c. The daily chart shows prices coiling above 71c, although resistance has emerged around the 10 and 20-day EMAs.
Prices opened positively in Asia today, and I also suspect AUD/USD has scope for further upside over the near term. But if volatility remains subdued and prices continue to drift higher, bears may look for reversal signals on lower timeframes, using the 71c region as an initial downside target. A break below there could bring the swing low near 70c into focus. This may allow the US dollar time to top out beneath recent highs before bears regain control and AUD/USD bulls reassess their positions.
Source: ICE, TradingView
View the full economic calendar
-- Written by Matt Simpson
Follow Matt on Twitter @cLeverEdge
How to trade with City Index
You can trade with City Index by following these four easy steps:
- Open an account, or log in if you’re already a customer
• Open an account in the UK
• Open an account in Australia
• Open an account in Singapore
- Search for the market you want to trade in our award-winning platform
- Choose your position and size, and your stop and limit levels
- Place the trade