Australian Technical Forecast: AUD/USD Weekly Trade Levels
- AUD/USD has advanced more than 7% from the January low before exhausting just ahead of the 2023 high.
- The four-week winning streak is now under pressure as price trades just below confluent resistance- risk rises for pullback within the broader uptrend.
- US Core PCE, Q4 GDP, and PMI figures on tap tomorrow.
- Resistance 7109/37 (key), 7208/14, 7427- Support 7000, 6902 (key), 6810
AUD/USD is consolidating just beneath a major long-term barrier after an extended advance from the January lows. The recent rally has carried price into a historically significant resistance zone, where prior upside attempts have struggled to gain traction. Momentum remains firm, but the inability to secure a decisive close above this threshold leaves the broader advance at an inflection point. A confirmed breakout would reinforce continuation toward higher objectives, while failure here could mark the beginning of a more meaningful retracement within the broader trend. Battle lines drawn on the AUD/USD weekly technical chart into the close of the month.
Australian Dollar Price Chart – AUD/USD Weekly
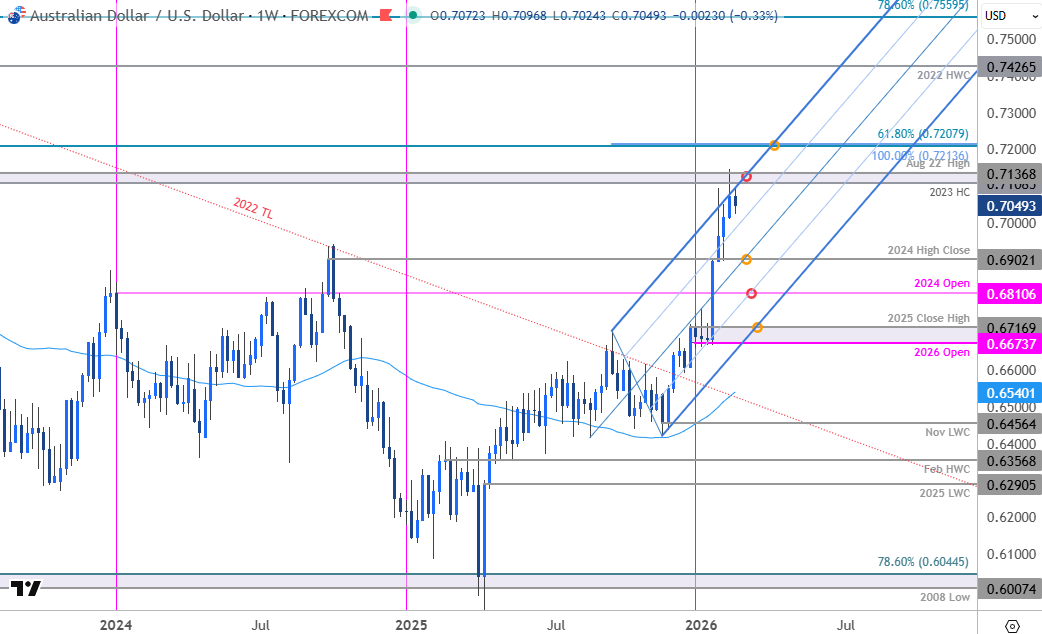
Chart Prepared by Michael Boutros, Sr. Technical Strategist; AUD/USD on TradingView
Technical Outlook: In last month’s Australian Dollar Forecast we noted that AUD/USD was testing lateral resistance as weekly momentum stretched into overbought territory for the first time in nearly five-years. “Losses should be limited to 6795 IF price is heading higher on this stretch with a close above 7008 ultimately needed to fuel the next major leg of the advance.” The rally continued into the following weeks with price extending more than 7.2% off the January low.
Aussie is now threatening to snap a four-week winning streak after exhausting into confluent uptrend resistance last week at 7108/37- a region defined by the 2023 high-close and the August 2022 swing high. Note that the upper parallel converges on this threshold into the close of the month and the focus is on possible inflection off this mark with the broader long-bias vulnerable while below. That said, weekly RSI remains in the overbought condition and keeps the momentum profile in favor of the bulls for now.
Initial support rests along the 75% parallel, currently near the 70-handle, and is backed by the 2024 high-close at 6902. The median-line converges on this threshold over the next few weeks and losses below this slope would suggest a more significant high is in place and a larger reversal is underway with in the broader uptrend. Subsequent support objectives are eyed at the 2024 yearly open at 6811 with broader bullish invalidation steady at the yearly open / 2025 close high at 6673-6717.
A topside breach / weekly close above this pivotal resistance zone is needed to fuel the next leg of the advance towards 7208/14- a region defined by the 100% extension of the 2025 advance and the 61.8% retracement of the 2021 decline. Look for a larger reaction there IF reached. Strength surpassing this level could fuel another bout of accelerated gains with the next major technical considerations eyed at the 2022 high-week close (HWC) at 7427 and the 78.6% retracement near 7560.

Bottom line: AUD/USD is trading just below confluent uptrend resistance and while the broader outlook remains constructive, the advance may be vulnerable while below this level near-term. From a trading standpoint, a good region to reduce portions of long-exposure / raise protective stops- losses should be limited to 6900 IF price is heading higher on this stretch with a close above 7137 needed to fuel the next leg of the advance.
Keep in mind we get the release of key US data into the close of the week with Core Personal Consumption Expenditures (PCE), Q4 GDP, and PMI figures on tap tomorrow. GDP is expected to show the US economy grew at an annualized pace of just 3% after a print of 4.4% in Q3. It is important to note that this data covers the longest US government shut down in history (43days). As such, a stronger than expected print would underscore underlying strength / resilience in the US market and could further fuel the Dollar advance. Stay nimble into these releases and watch the weekly close for guidance here. Review my latest Australian Dollar Short-term Outlook for a closer look at the near-term AUD/USD technical trade levels.
Australia / US Economic Calendar
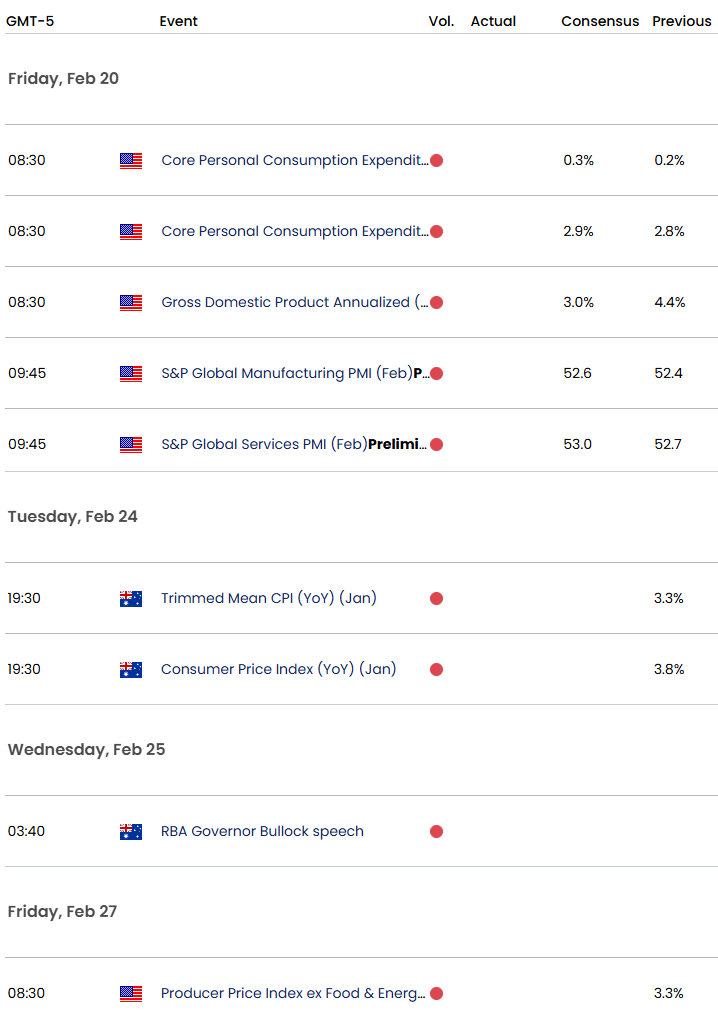
Economic Calendar - latest economic developments and upcoming event risk.
--- Written by Michael Boutros, Senior Technical Strategist
Follow Michael on X @MBForex