Australian Technical Forecast: AUD/USD Weekly Trade Levels
- AUD/USD has staged a strong multi-week recovery after a sharp decline from recent highs
- Price is now testing a major resistance zone that has capped gains previously
- A sustained breakout would signal continuation of the broader uptrend while failure risks another pullback within the current range
- Event risk on tap: Australian employment data, Iran war headlines
- Resistance 7109/37 (key), 7209/14, 7295- Support ~7030s, 6981 (key), 6861/77
AUD/USD has mounted a strong recovery in recent weeks, reversing a sharp pullback and driving price back into a pivotal resistance zone. The rebound highlights a shift in near-term momentum, but the broader outlook now hinges on how price reacts at this key barrier. With the pair testing a level that previously capped gains, the next move could prove decisive in determining whether the uptrend resumes or a deeper correction unfolds. Battle lines drawn on the AUD/USD weekly technical chart.
Australian Dollar Price Chart – AUD/USD Weekly
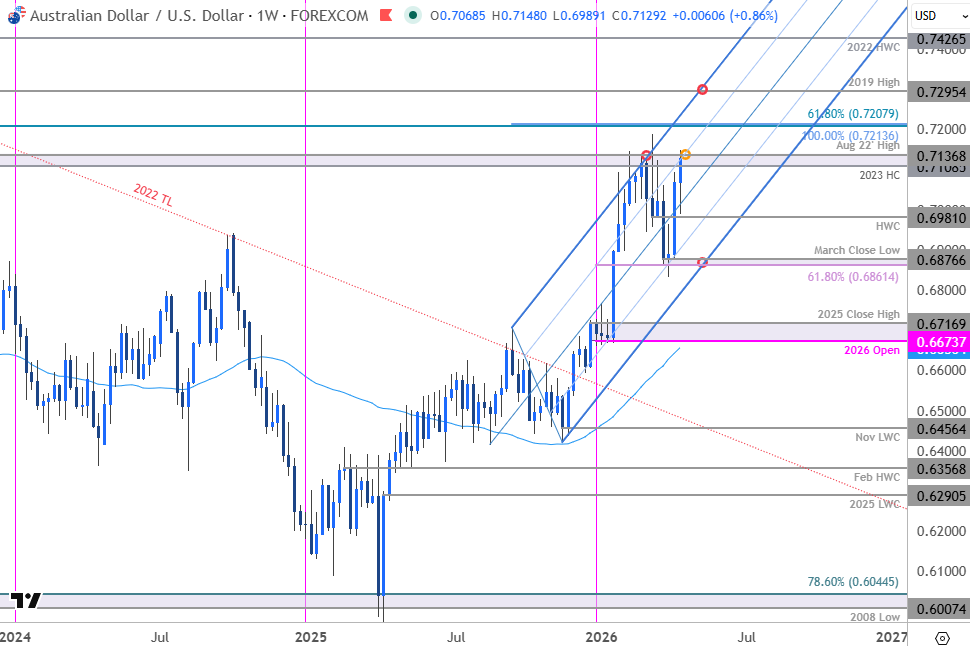
Chart Prepared by Michael Boutros, Sr. Technical Strategist; AUD/USD on TradingView
Technical Outlook: In last month’s Australian Dollar Forecast we highlighted that AUD/USD was trading into confluent uptrend resistance at the 2023 high close and the August 2022 swing high at 7109/37. We noted that, “a weekly close above is needed to keep the bulls in control. From a trading standpoint, losses should be limited to 7109 IF price is heading higher on this stretch..” Resistance held that week with Aussie plunging more than 4.9% off the highs into the close of the month. Price is now poised to mark a third consecutive weekly advance with a 4.6% recovery approaching key resistance once again. Looking for a reaction off this mark in the days ahead.
Initial weekly support now rests at the median-line (currently ~7030s) and is backed by the yearly high-week close (HWC) at 6981. Key support rests with the 61.8% retracement of the yearly range and the March close low at 6861/77. Note that the lower parallel converges on this threshold over the next few weeks and losses below this slope would be needed to suggest a more significant high is in place and invalidate the 2025 uptrend.
A topside breach / weekly close above 7137 is needed to mark uptrend resumption towards 7208/14- a region defined by the 61.8% retracement of the 2021 decline and the 100% extension of the 2025 advance. Subsequent resistance is eyed at the 2019 swing high at 7295 which converges on the upper parallel into the monthly cross.

Bottom line: A three-week recovery takes AUD/USD back into pivotal resistance near the yearly high - risk for inflection here. From a trading standpoint, a good zone to reduce portions of long-exposure / raise protective stops – losses should be limited to this week’s low IF price is heading for a breakout on this stretch with a close above this pivot zone needed to expose a rally towards the next major hurdle at 7200.
Keep in mind we get the release of Australia employment data tomorrow with risk sentiment still hyper-sensitive to developments out of Iran. Watch the weekly close here for guidance. I’ll publish an updated Australian Dollar Short-term Outlook once we get further clarity on the near-term AUD/USD technical trade levels.
Australia / US Economic Calendar
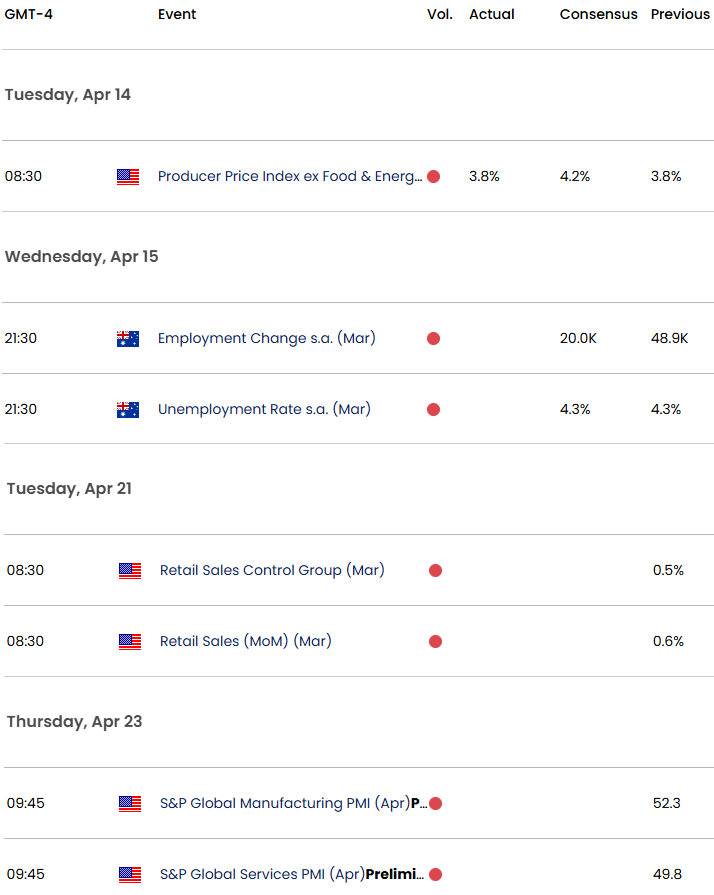
Economic Calendar - latest economic developments and upcoming event risk.
--- Written by Michael Boutros, Senior Technical Strategist
Follow Michael on X @MBForex