



Bitcoin Technical Forecast: BTC/USD Weekly & Daily Trade Levels
- Bitcoin is attempting its first meaningful rebound since the January selloff, recovering sharply after a 52% collapse from record highs.
- Price is now approaching a heavy resistance band near 70K- a key pivot zone throughout February.
- A sustained move above this barrier would threaten a near-term recovery attempt within the broader downtrend, while rejection here keeps the downside risk active.
Bitcoin is attempting to stabilize after one of its most aggressive drawdowns in recent years, with price surging more than 11.2% off the February low close. The rebound takes BTC/USD back toward pivotal resistance and while momentum has improved, the broader trend remains under pressure unless buyers can force a sustained move through this ceiling. The coming sessions may determine whether this is the beginning of a larger recovery phase or merely a corrective bounce within the prevailing downtrend. Battle lines drawn on the BTC/USD technical charts.
Bitcoin Price Chart – BTC/USD Weekly
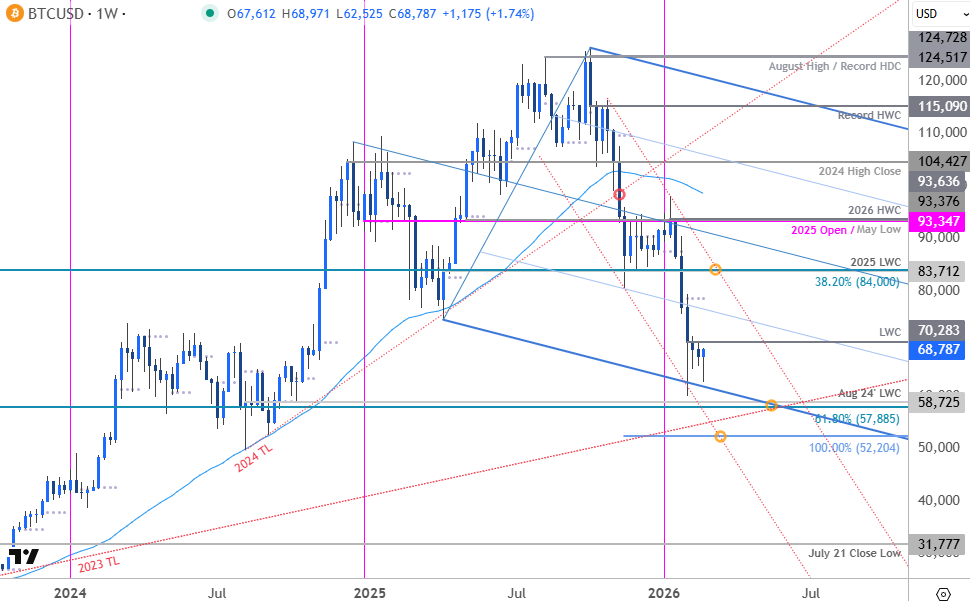
Chart Prepared by Michael Boutros, Sr. Technical Strategist; BTC/USD on TradingView
In last month’s Cryptocurrency Forecast we noted that Bitcoin was testing major support near 84,000 and that, “losses below this level would threaten resumption of the multi-month downtrend in BTC/USD. From a trading standpoint, rallies should be limited to 87,496 IF price is heading lower on this stretch with a close below 83,712 still needed to fuel the next major leg of the decline.” Bitcoin broke lower later that week with the decline extending more than 38.8% off the January high before rebounding off downtrend support in early February.
The bulls are poised to snap a five-week decline into the close of the month with weekly momentum attempting to recover from overbought territory after a four-week stint below. Although the broader risk remains weighted to the downside, the bears may be vulnerable to a near-term recovery heading into March trade. Note that the November recovery extended more than 21.6% off the lows before turning lower and IF this rebound is corrective in nature, the rally could extend towards 74K without invalidating the broader downtrend.

Bitcoin Price Chart – BTC/USD Daily
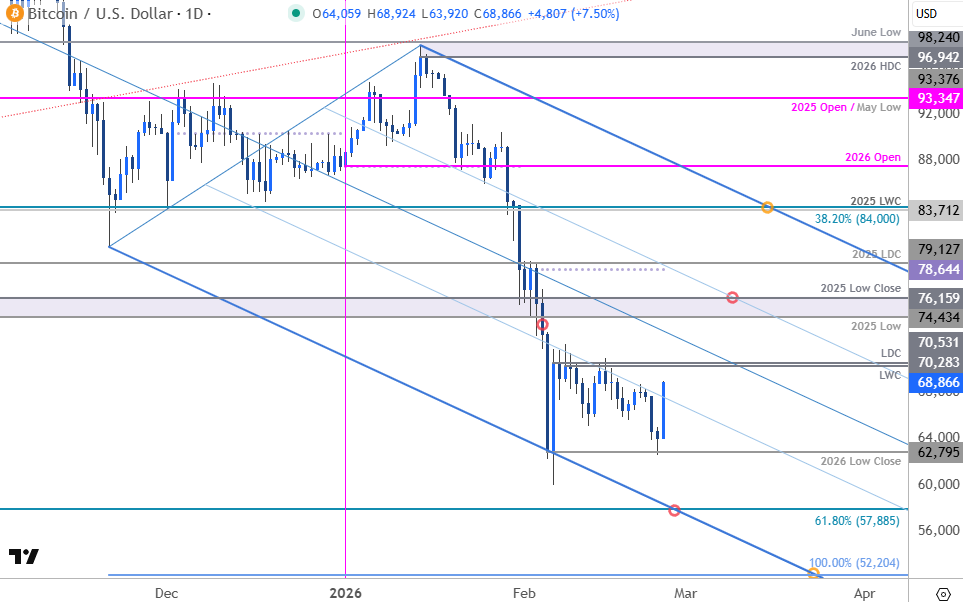
Chart Prepared by Michael Boutros, Sr. Technical Strategist; BTC/USD on TradingView
A closer look at the Bitcoin daily chart shows BTC/USD trading within the confines of a descending pitchfork extending off the yearly high with price attempting to breach the 38.2% parallel today. Near-term resistance is eyed just higher at the 2026 low-week (LWC) / low-day close (LDC) at 70,283/531 and the 2025 swing low / low-close at 74,434-76,159. A top-side breach / daily close above this threshold would suggest a more significant near-term low is in place and threaten a larger recovery within the broader downtrend. Subsequent resistance is eyed at the 2025 low-day close at 79,127 with broader bearish invalidation now lowered to the 2025 LWC and the 38.2% retracement 2022 advance at 83,712-84,000. Strength beyond this threshold would be needed to suggest a larger trend reversal is underway.
Initial support rests with the yearly low-close at 62,795- a daily close below this level would threaten resumption of the broader downtrend with subsequent support seen at 61.8% retracement at 57,885 and the 100% extension of the decline off the record high at 52,204. Both these levels represent areas of interest for possible downside exhaustion / price inflection IF reached.
Bottom line: Bitcoin is attempting its first meaningful recovery since the January sell-off and the immediate focus is on potential inflection near 70,238/531 IF reached. A close above would keep the near-term focus higher in BTC/USD. From a trading standpoint, rallies would need to be limited to 76,159 for the October downtrend to remain viable with a close below 62,795 needed to fuel the next leg of the decline.
--- Written by Michael Boutros, Senior Technical Strategist
Follow Michael on X @MBForex






