
British Pound Technical Forecast: GBP/USD Weekly Trade Levels
- GBP/USD rebounded sharply after a three-week decline, forming an outside-weekly reversal off Fibonacci support.
- The recovery is now testing initial resistance near the January high-close- the reaction here should determine whether this move extends or stalls.
- Resistance 1.3502, 1.3573, 1.3648 (key)- Support 1.3355 (key), ~1.3268, 1.3223
Sterling has rebounded decisively after a three-week decline, with GBP/USD reversing higher from Fibonacci support early in the week. The recovery has carried price into its first meaningful resistance zone, where sellers have previously defended the downtrend. The response here will be critical in determining whether the rebound can evolve into a broader recovery or if the move fades into another lower high. Traders should stay alert as price action around this hurdle is likely to define near-term direction for the Pound. Battle lines drawn on the GBP/USD weekly technical chart.
British Pound Price Chart – GBP/USD Weekly
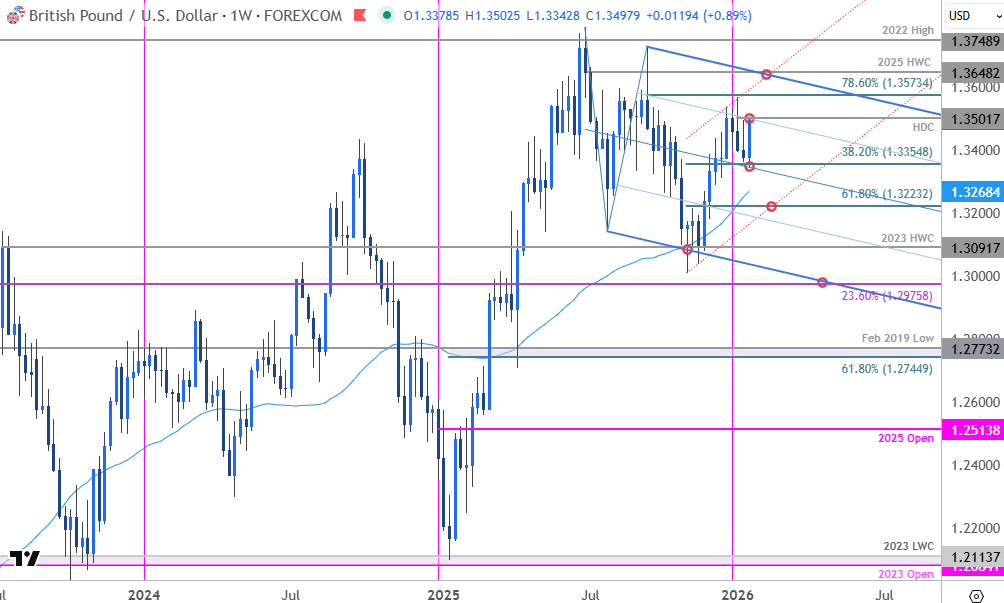
Chart Prepared by Michael Boutros, Sr. Technical Strategist; GBP/USD on TradingView
Technical Outlook: In last month’s British Pound Weekly Forecast we noted that GBP/USD was testing resistance and, “the immediate focus is on a breakout of the 1.3280-1.3372 range for guidance.” The range broke higher the following week with the Sterling rally extending nearly 4.3% off the November low to register an intraweek high at 1.3568 into the yearly open. A three-week decline rebounded off support this week the 38.2% retracement of the November rally at 1.3355 with price now poised to mark an outside-weekly reversal.
The focus is on this recovery with the rally now testing resistance at the January high-day close (HDC) and the 75% parallel of a descending pitchfork extending off the 2025 highs near 1.3502. A break / close above this slope would expose the 78.6% retracement of the September decline at 1.3573 and the 2025 high-week close (HWC) at 1.3648. Note the upper parallel converges on this level over the next few weeks – look for a larger reaction there IF reached. Subsequent resistance objective eyed at the 2022 high at 1.3749.
A break / close below this week’s low would threaten a larger setback towards the 52-week moving average (currently ~1.3268) and key support at the 61.58% retracement at 1.3223. Note that basic trendline support extending off the November lows converges on this threshold over the next few weeks and losses below this level would suggest a more significant high is in place and a larger breakdown is underway.

Bottom line: A rebound off downslope support is testing initial resistance – risk for infection off this mark in the days ahead. From a trading standpoint, a good zone to reduce portions of long-exposure / raise protective stops – losses should be limited to 1.3355 IF price is heading higher on this stretch with a weekly close above 1.3502 needed to fuel the next leg of the advance.
Keep in mind we get the release of UK retail sales tomorrow with the FOMC interest rate decision on tap next week. Markets are widely expecting the Fed to hold rates, and the focus will be on Chair Powell's subsequent commentary. With today’s weekly jobless claims release showing resiliency in the labor markets, the central bank may be more reluctant to move on rates as inflation remains well-above the 2% target. In his last presser, Powell stated that there were risks on both sides of the mandate, and if the jobs data continues to improve, the markets may have to reprice expectations for two rate cuts this year. Stay nimble into the release and watch the weekly closes here for guidance. Review my latest British Pound Short-term Outlook for a closer look at the near-term GBP/USD technical trade levels.
GBP/USD Economic Data Releases
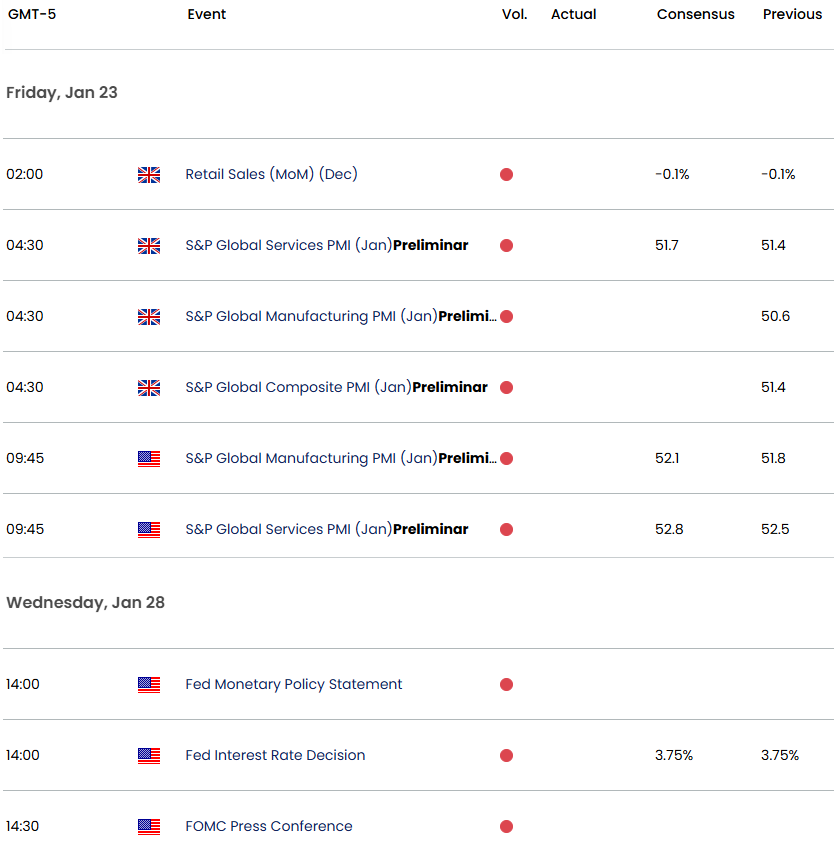
Economic Calendar - latest economic developments and upcoming event risk.
--- Written by Michael Boutros, Senior Technical Strategist
Follow Michael on X @MBForex