
British Pound Technical Outlook: GBP/USD Short-Term Trade Levels
- British Pound on pace for a fifth consecutive daily decline- now approaching confluent downtrend support
- GBP/USD focus is on a potential reaction from this zone- UK retail Sales / U.S. CPI on tap tomorrow
- Resistance 1.3371, 1.3445 (key), 1.3593-1.3626- Support 1.3267/80 (key), 1.3207/21, 1.3125/44
The British Pound continues to weaken, with GBP/USD sliding for a fifth consecutive session as price approaches confluent support at the median-line. The focus is on whether this zone can prompt a reaction or if the broader decline will extend into next week. Major event risk lies ahead, with UK retail sales and U.S. CPI data due tomorrow, followed by the Fed’s interest rate decision next week — a combination that could spark volatility and define the near-term path for Sterling.
British Pound Price Chart – GBP/USD Daily
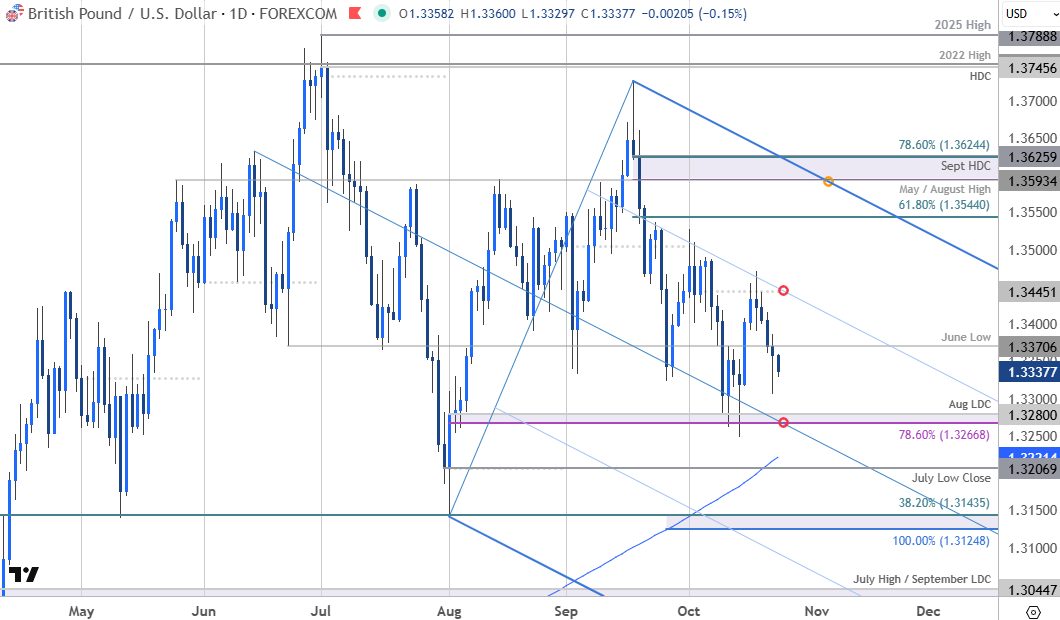
Chart Prepared by Michael Boutros, Sr. Technical Strategist; GBP/USD on TradingView
Technical Outlook: In my last British Pound Short-term Outlook, we noted that GBP/USD was, “carving the October opening-range just below downtrend resistance – look for a breakout in the days ahead for guidance here. From a trading standpoint, rallies should be limited to 1.3587 IF price is heading lower on this stretch with a close below the median-line needed to suggest a more significant high is in place / fuel the next leg lower price.” Sterling attempted to break below the median-line three-times with price unable to mark a daily close below. A reversal off the monthly open / 75% parallel on Friday takes price back towards the monthly lows and the focus once again shifts to a potential test / break of key support.
British Pound Price Chart – GBP/USD 240min
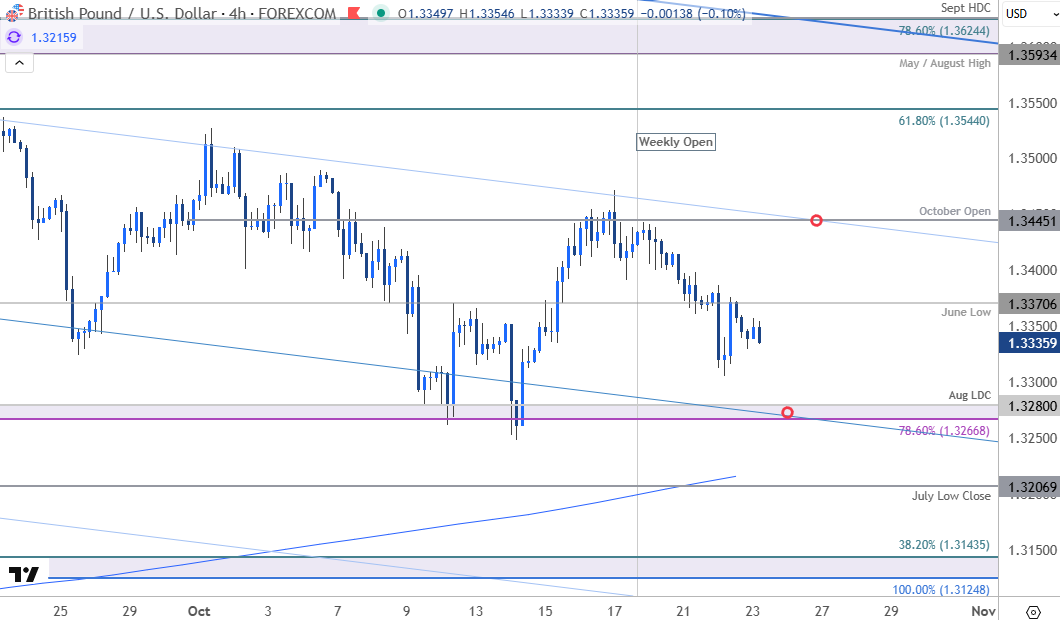
Chart Prepared by Michael Boutros, Sr. Technical Strategist; GBP/USD on TradingView
Notes: A closer look at Sterling price action shows GBP/USD sliding more than 1.2% off the Friday high after marking an outside reversal off downtrend resistance. Key support rests with the 78.6% retracement of the August rally / the August low-day close (LDC) at 1.3267/80- note that the median-line converges on this threshold into the close of the week and a break / close below would be needed to fuel the next leg of this decline with subsequent support objectives seen at the 200-DMA at ~1.3221 and the July low close 1.3207. The next major technical consideration rests at 1.3125/44- a region defined by the 100% extension of the September sell-off, the August swing low, and the 38.2% retracement of the yearly range. Look for a larger reaction there IF reached (are of interest for possible downside exhaustion / price inflection).
Initial resistance is eyed at the June low at 1.3371 and is backed by the weekly opening-range high / October open at 1.3445- a breach / close above this pivot zone would be needed to suggest a more significant near-term low is in place / a larger recovery is underway. Subsequent resistance eyed at the 61.8% retracement of the September decline at 1.3544 and 1.3593-1.3626- a region defined by the May / August highs, the 78.6% retracement, and the September high-day close (HDC). A close above this key threshold would be needed to invalidate the July downtrend.

Bottom line: The British Pound is poised to mark a fifth daily decline with GBP/USD now approaching confluent support at the median-line. From a trading standpoint, rallies should be limited to 1.3445 IF price is heading lower on this stretch with a close below 1.3267 needed to fuel the next major leg of this decline.
Keep in mind we get the release of U.S. inflation data on Friday with the FOMC interest rate decisions on tap next week. Stay nimble into the releases and watch the weekly closes for guidance. Review my latest British Pound Weekly Forecast for a closer look at the longer-term GBP/USD technical trade levels.
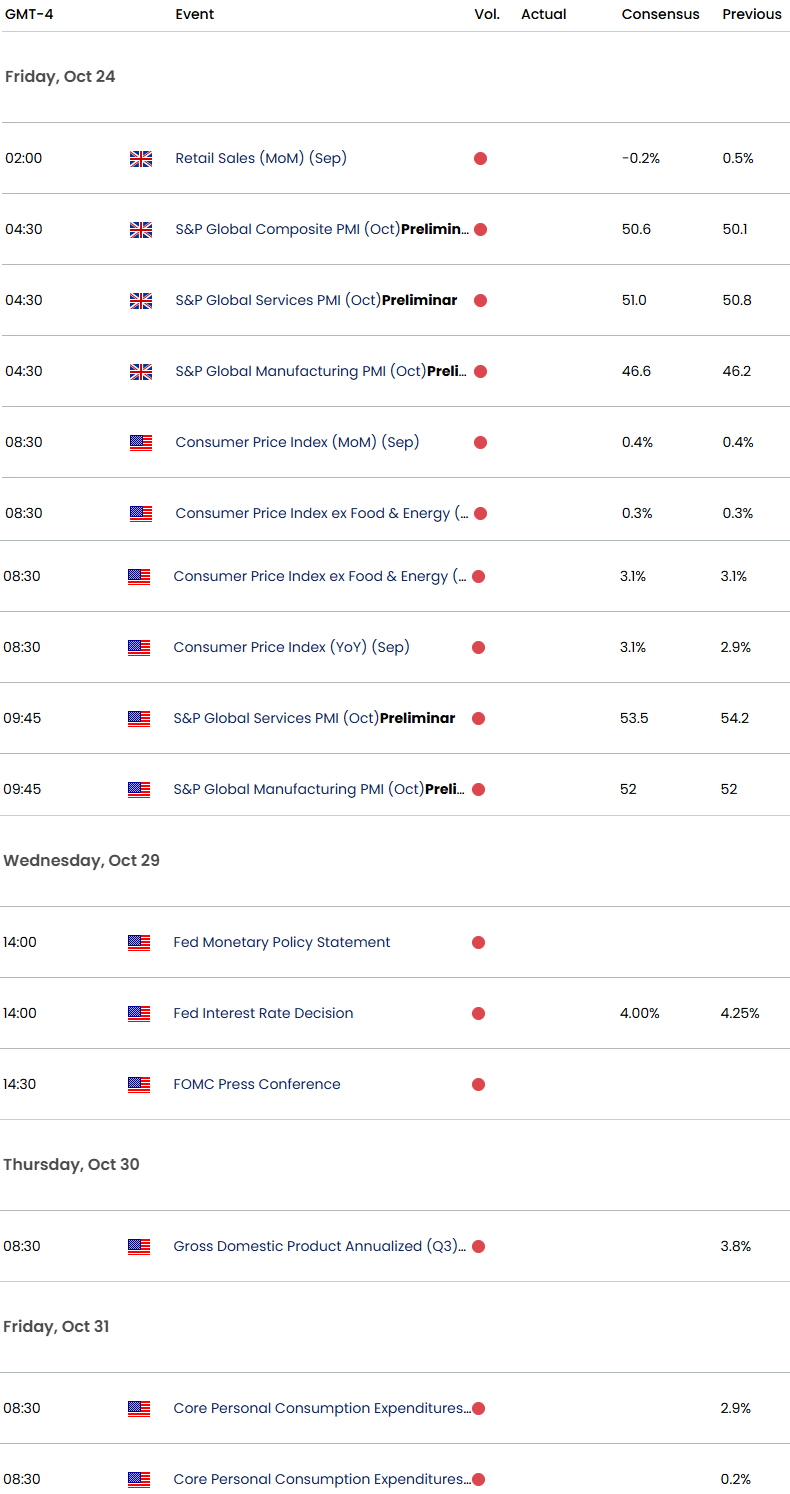
Key GBP/USD Economic Data Releases
--- Written by Michael Boutros, Sr Technical Strategist
Follow Michael on X @MBForex