
British Pound Technical Outlook: GBP/USD Short-Term Trade Levels
- GBP/USD is attempting to break above technical resistance after a rebound from support.
- Focus is on a reaction off this level- Failure to hold above would suggest a false breakout and reversal risk while a sustained move higher would mark uptrend resumption.
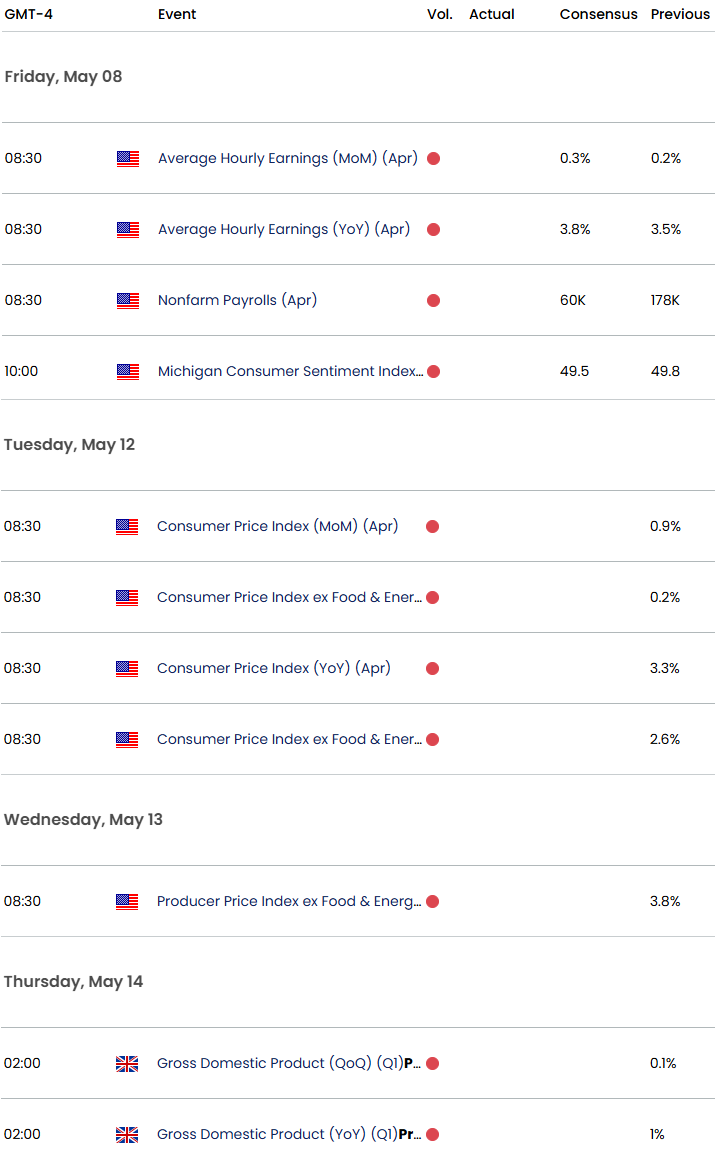
- Event risk: U.S. Non-Farm Payrolls on tap into the close of the week- CPI next week
- Resistance 1.3593-1.3604 (key), 1.3685, 1.3746/49- Support 1.3512, 1.3465/74 (key), ~1.3418
GBP/USD is testing a breakout above a key resistance zone after rebounding more than 3.6% from the yearly low. This marks the first meaningful challenge for the April advance, with fading momentum raising the risk of a failed move. The focus now shifts to whether buyers can sustain the push higher or if the breakout begins to unravel in the sessions ahead. Battle lines drawn on the GBP/USD short-term technical charts.
British Pound Price Chart – GBP/USD Daily
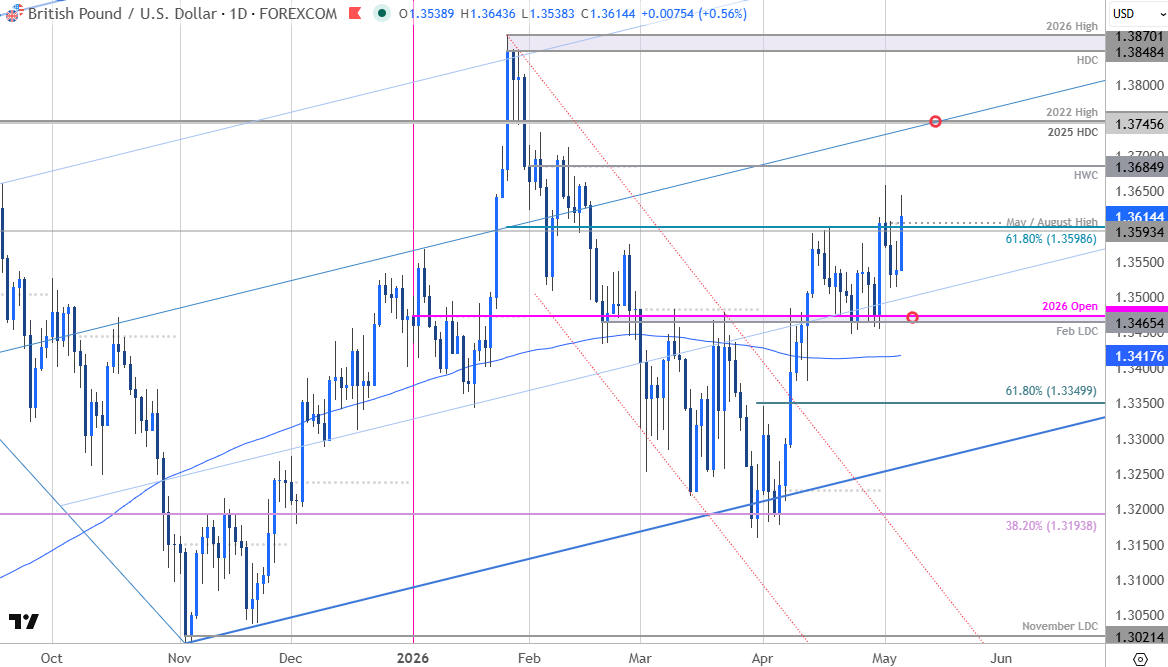
Chart Prepared by Michael Boutros, Sr. Technical Strategist; GBP/USD on TradingView
Technical Outlook: In last month’s British Pound Short-term Outlook, we noted that, “A breakout of a multi-month Sterling downtrend is now testing the first major resistance hurdle- risk for price inflection here. From a trading standpoint, losses should be limited to the 200-day moving average IF price is heading higher on this stretch with a close above 1.36 needed to fuel the next major leg of the advance.” GBP/USD fell more than 1.1% off those highs before rebounding off pivotal support last week at the February low-day close (LDC) and the yearly open at 1.3465/74.
The rebound is now attempting to breach confluent resistance at 1.3593-1.3604- a region defined by the 2024 May & August highs, the 61.8% retracement of the yearly range, and the objective May open. Watch the close today with respect to this threshold for guidance- failure to hold above could prove exhaustive near-term.
British Pound Price Chart – GBP/USD 240min
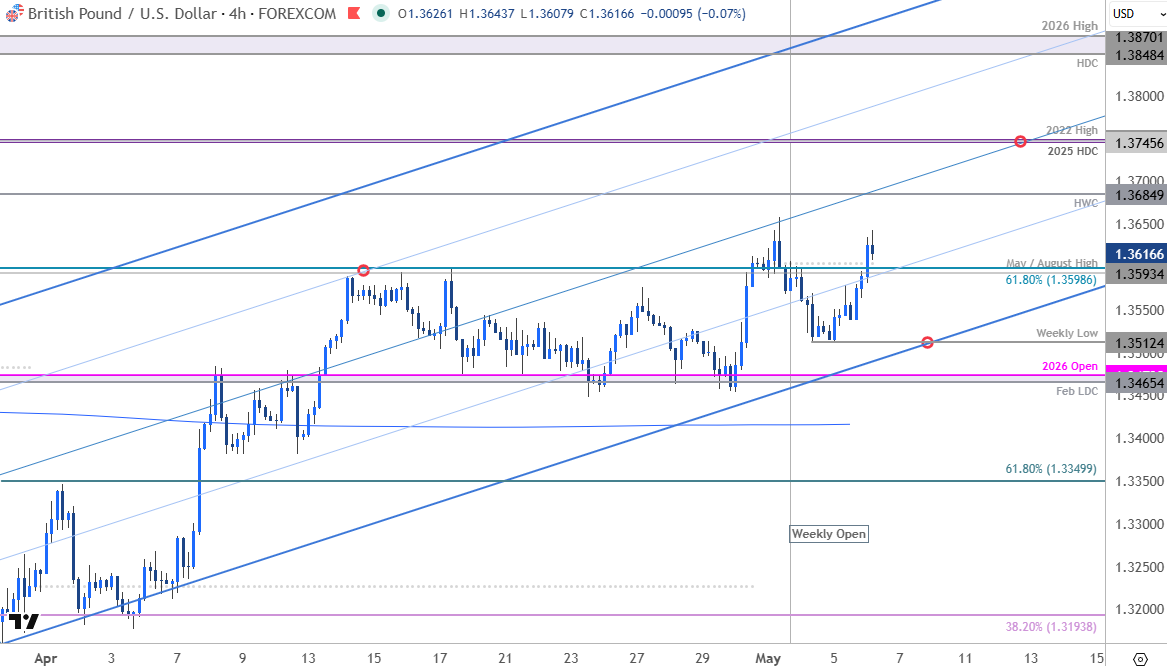
Chart Prepared by Michael Boutros, Sr. Technical Strategist; GBP/USD on TradingView
Notes: A closer look at Sterling price action shows GBP/USD continuing to trade within the confines of the ascending pitchfork we have been tracking since late-March. The weekly low converges on the lower parallel at 1.3512 and is backed by bullish invalidation at the 1.3465/74 pivot zone. Ultimately, the bears would need to secure a close below the 200-day moving average near 1.3418 to suggest a more significant high is in place.
A close above 1.3604 would keep the long-bias viable into the close of the week with subsequent resistance objectives eyed at the yearly high-week close (HWC) at 1.3685 and the 2025 high-day close (HDC) / 2022 high at 1.3745/49. Note that the median-line converges on this zone next week- look for a larger reaction there IF reached.

Bottom line: Sterling is attempting to break technical resistance at multi-month highs- watch the close today with respect to the 1.36-handle. From a trading standpoint, losses would need to be limited to 1.3512 IF price is heading higher on this stretch with a break of the monthly highs needed to mark uptrend resumption.
Keep in mind we get the release of key U.S. labor data with the March Non-Farm Payrolls report on tap Friday. Stay nimble into the release and watch the weekly close here for guidance. Review my latest British Pound Weekly Forecast for a closer look at the longer-term GBP/USD technical trade levels.
Key GBP/USD Economic Data Releases
--- Written by Michael Boutros, Senior Technical Strategist
Follow Michael on X @MBForex