



Oil prices have edged lower this week, despite ongoing tensions around Iran and the Strait of Hormuz. That might seem counterintuitive given the headlines, but it reflects a market increasingly focused on what could happen next, rather than what’s happening right now.
Comments from Donald Trump suggesting the war may soon come to an end have helped calm nerves, with traders betting that a resolution could eventually see oil flows resume through the region. That optimism has been enough to take some of the heat out of crude, even as risks remain elevated.
View related analysis:
- Japanese Yen Price Action Setups: USD/JPY, AUD/JPY, CHF/JPY
- WTI Crude Oil Crashes as Traders Dump Risk Premium
- Australian Dollar Soars as Iran Ceasefire Fuels Risk-On Rally
- AUD/USD Outlook 2026: Key Drivers for the Australian Dollar in Q2
Crude Oil Outlook: Supply Risks Clash with De-Escalation Expectations
Oil Prices Ease Despite Ongoing Middle East Tensions
However, the situation on the ground hasn’t materially improved. The US has stepped up pressure with a naval blockade targeting Iranian-linked shipping, while the Strait of Hormuz itself is still facing security challenges. In other words, supply hasn’t normalised—it’s just that markets are choosing to look through the disruption for now.
Supply Risks Persist Even as Markets Look Ahead
That leaves oil caught between two forces: near-term constraints on supply, and growing confidence that they may not last. Whether prices continue to drift lower from here will likely depend on which of those narratives proves right in the days ahead.
One way to gauge how traders are pricing that balance is through the crude oil time spread.

Crude Oil Spread Signals Easing Fear, But Risk Premium Remains
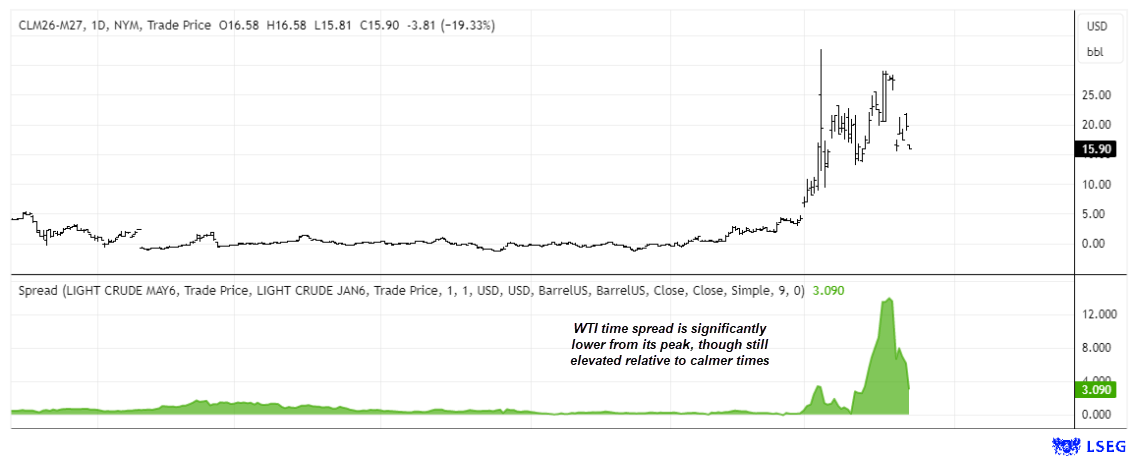
This chart shows the WTI crude oil time spread (calendar spread) between near-term and longer-dated futures, reflecting shifts in supply stress and market sentiment.
The sharp surge in the crude oil spread shows just how worried traders were about near-term supply, with front-month prices jumping well above later contracts. But the recent pullback suggests some of that fear is easing, likely as hopes of de-escalation grow. That said, the spread remains elevated, signalling the market is still pricing in a meaningful level of risk rather than returning to normal.
Source: NYMEX, LSEG
Crude Oil Futures Positioning | COT Report
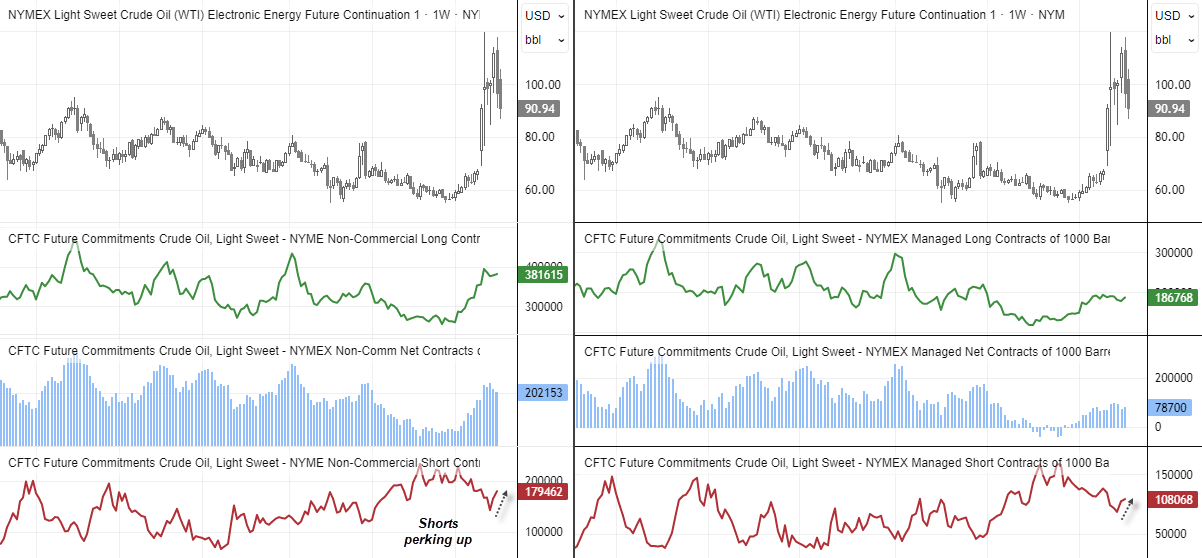
The biggest takeaway from recent crude oil futures positioning is that large speculators and asset managers have increased gross shorts over the past two weeks. While there is still a long way to go before we can safely assume the war is over, it at least suggests some oil traders are beginning to speculate that it might be.
And while gross longs have also edged higher, net-long exposure has been trending lower among both groups of traders in recent weeks.
Overall, crude oil futures traders appear to be toying with the idea that the worst of the war may be behind us, but they are far from convinced. Regardless, concerns remain, with oil prices still trading around $20 higher than they were before the war.
Source: CFTC (COT), NYMEX, LSEG
WTI Crude Oil Futures (CL) Technical Analysis
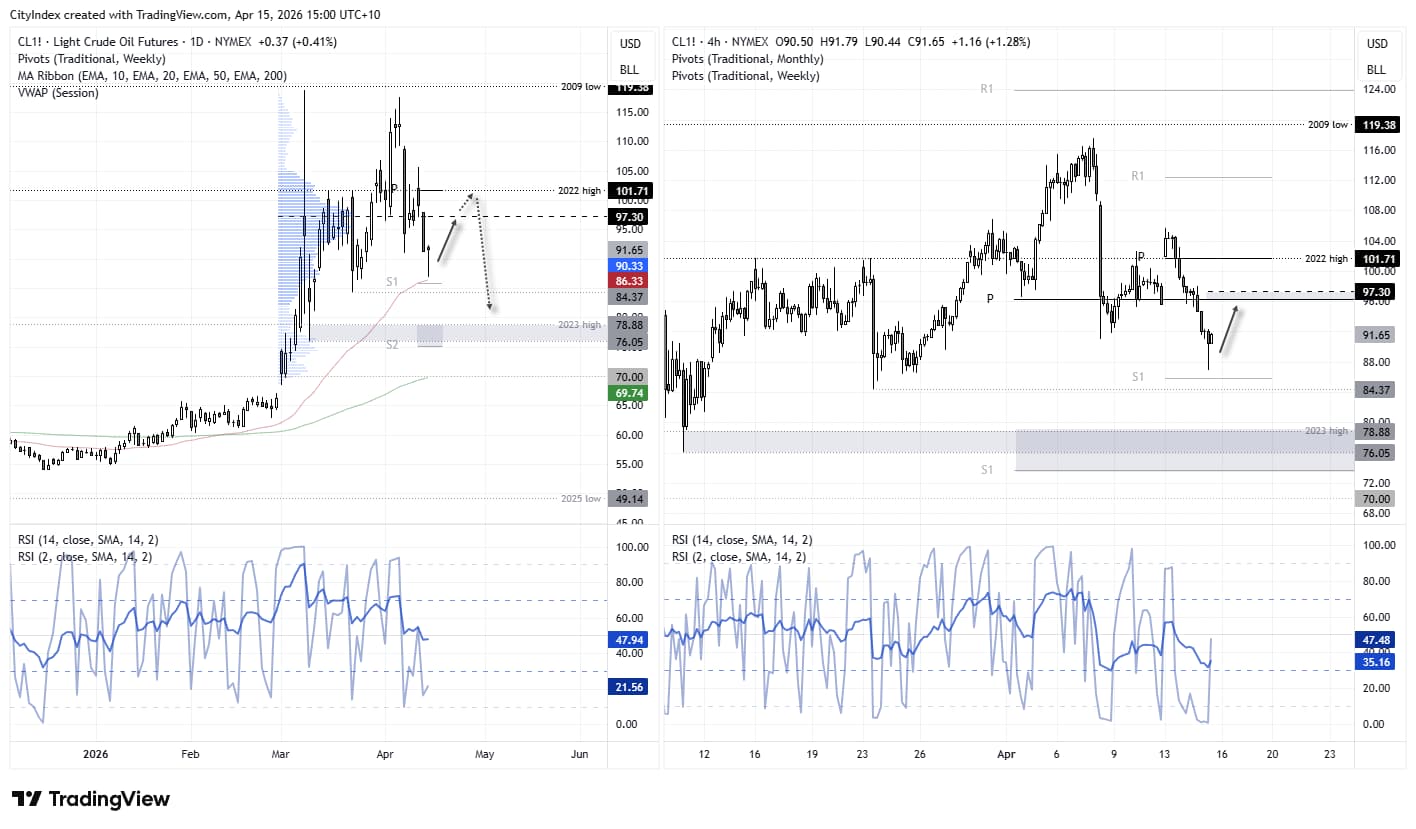
We’re yet to see crude oil retest the 118.80 high set when the war broke out in March. We came close on April 7, but thankfully a breakout was avoided. Prices were down -26.8% from the March high earlier today as President Trump touted the end of the war, but without confirmation from Iran, prices have since bounced. Perhaps that bounce has more to give.
Today’s low held above the 50-day EMA and weekly S1 pivot, and the session is currently on track to form a bullish hammer. Unless we see concrete steps towards de-escalation, I suspect there’s a decent chance of bullish mean reversion.
Note the high-volume node (HVN) sits around 97.30, near the monthly pivot point, making it a potential near-term target for bulls while prices hold above 86.
Further out, $80 seems a likely target for bears should talks be perceived to be going well (even if they prove to be unfruitful), with the 2023 high (78.88) and post-war swing low (76.05) also coming into view for bears.
 Source: NYMEX, TradingView
View the full economic calendar
-- Written by Matt Simpson
Follow Matt on Twitter @cLeverEdge
How to trade with City Index
You can trade with City Index by following these four easy steps:
- Open an account, or log in if you’re already a customer
• Open an account in the UK
• Open an account in Australia
• Open an account in Singapore
- Search for the market you want to trade in our award-winning platform
- Choose your position and size, and your stop and limit levels
- Place the trade





