
- EUR/USD and GBP/USD trading as crude proxies, not rate plays
- Strong inverse correlation with oil driving moves over the past week
- ECB and BoE expected to hold, hikes already priced
- Communication key, but energy still steering expectations
- Both pairs rangebound, providing clean levels to work with
Energy driving FX, not rates
The impact from the ECB and BoE monetary policy decisions later today may prove fleeting if it runs counter to what’s happening in energy markets, with both EUR/USD and GBP/USD effectively trading as proxies for crude right now rather than rate differentials.
Source: TradingView
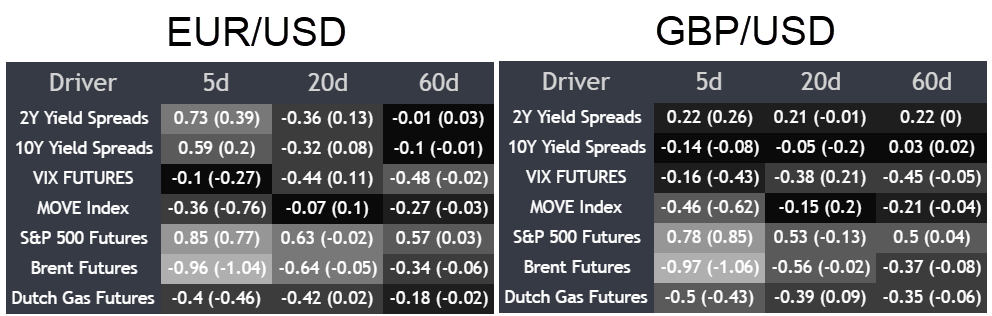
The correlation matrix makes that clear. Over the past five days, both pairs show a near-perfect inverse relationship with Brent, sitting around -0.96 to -0.97, meaning when crude rises, EUR/USD and GBP/USD have almost consistently fallen, and vice versa. For context, a correlation coefficient close to -1 signals a very strong inverse relationship, while +1 indicates they move in lockstep.
That relationship dominates everything else. Even the positive correlation with equities is being influenced by moves in crude, with energy driving broader sentiment and taking focus away from earnings. Rate differentials, particularly at the front-end, show little sustained relationship. Even where correlations with two-year spreads are positive, they’re weak and inconsistent across time horizons, underlining that moves in EUR/USD and GBP/USD are not being driven by rates right now.
Hawkish pricing already embedded
Source: Bloomberg
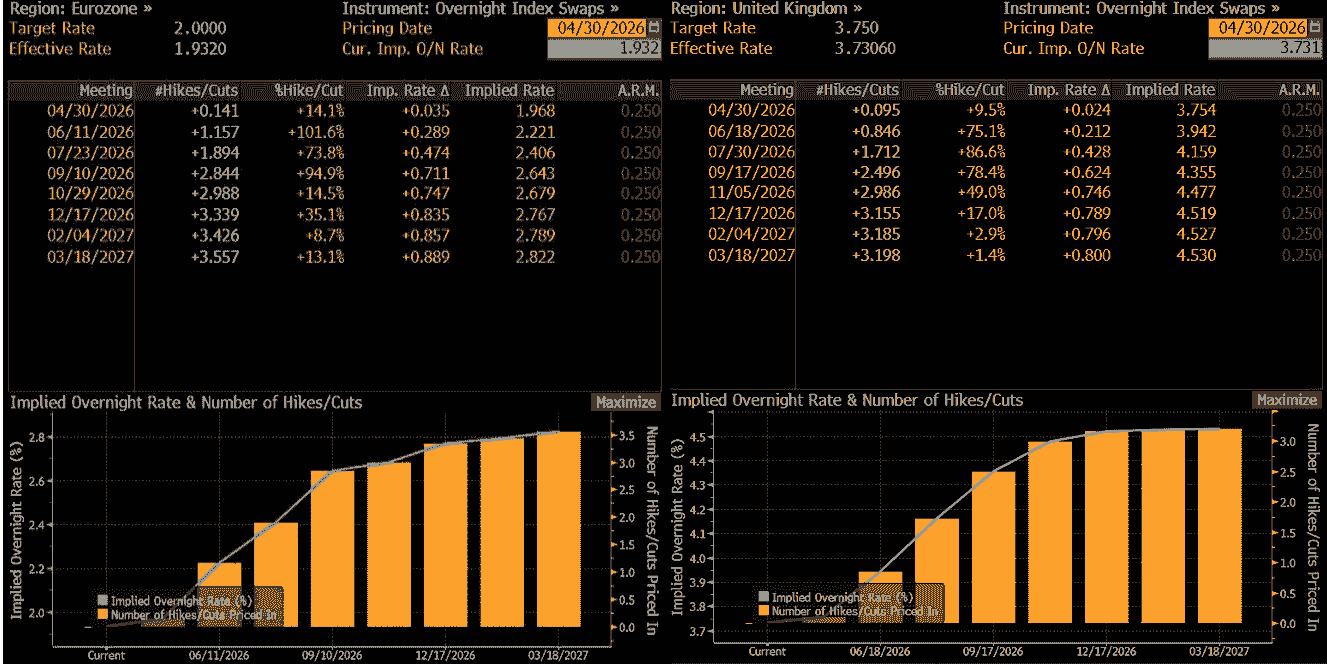
That leaves both the ECB and BoE decisions later today likely to have less impact than usual. Neither is expected to move, but markets are already hawkishly positioned, with OIS pricing more than three hikes over the next year for both, something clearly reflected in the Bloomberg graphic on implied policy rate probabilities. The ECB is effectively fully priced to pull the trigger in June with the BoE not far off. That means the tone needs to be clearly hawkish to justify what’s already in the curve, especially given the inflation impulse coming from energy.
Assuming no surprise hike from either, the focus shifts to communication. For the ECB, it’s all about the tone of the statement and President Christine Lagarde’s press conference, including any hints of disunity within the Governing Council, particularly if more members are leaning towards hiking. For the BoE, the vote split will be key, with multiple dissents in favour of a hike likely needed to at least meet market expectations. The wording of the statement and updated forecasts will also need to lean clearly hawkish to justify what’s already priced into the curve.
Data and decisions collide
Source: TradingView
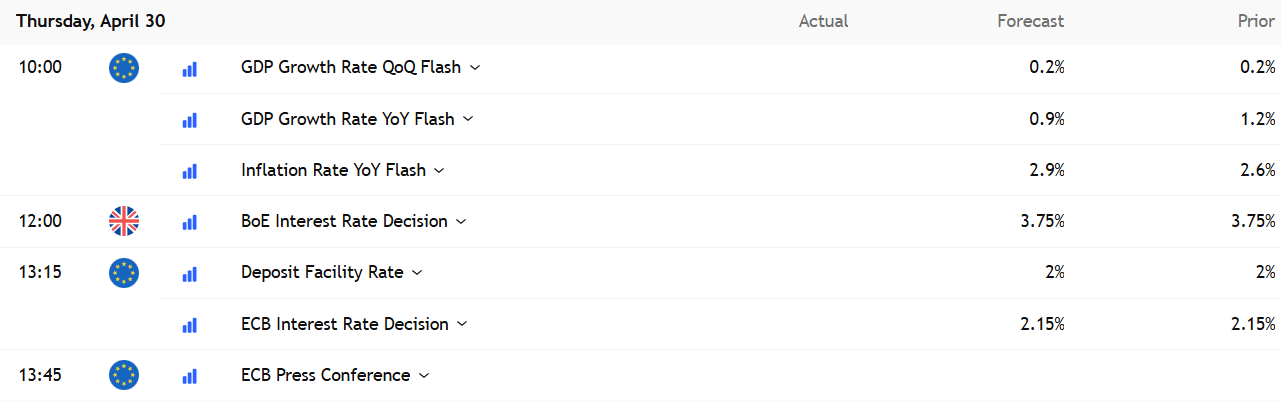
The rate decisions and key economic data will arrive in quick succession through the London session. Euro area flash GDP and inflation data hit at 10am, followed by the BoE decision at 12pm, then the ECB rate call at 13:15pm and President Christine Lagarde’s press conference at 1:45pm. While the GDP and CPI releases will provide an updated snapshot on activity and price pressures, they continue to play a secondary role for FX at the moment. With the outlook for energy prices likely to heavily influence both growth and inflation from here, backward-looking data offers limited value in deciphering the reaction function from either central bank, or how FX responds around these events.
Trading the range
With that macro backdrop dominated by energy markets, both EUR/USD and GBP/USD head into these risk trading within well-defined ranges, providing clear levels for traders to work with when assessing setups.
Source: TradingView
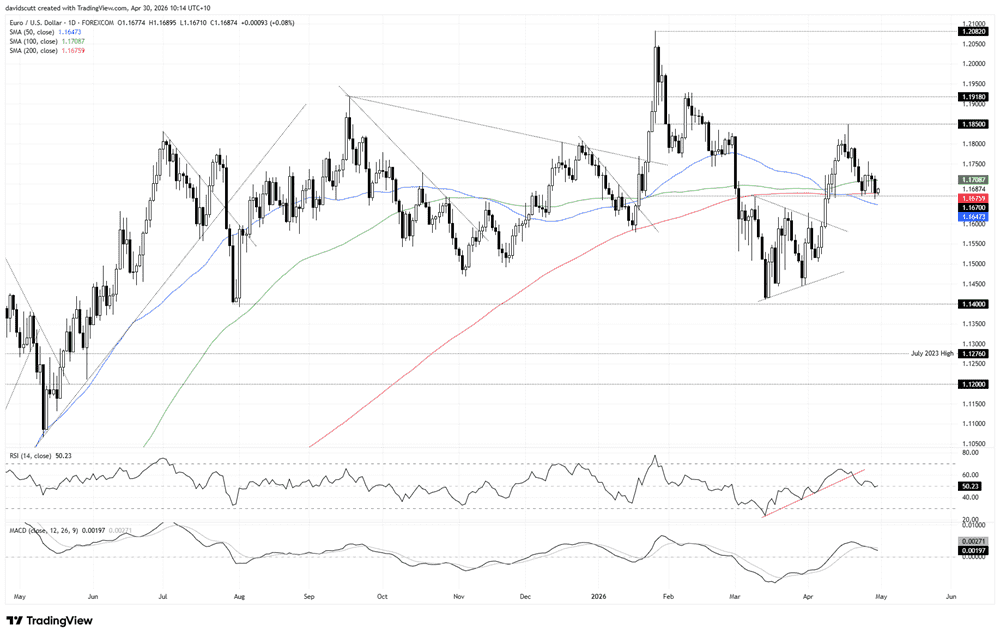
EUR/USD trades at the bottom of its prevailing sideways range, continuing to attract bids on dips towards the confluence of the 200-day moving average and horizontal support at 1.1670. That’s the immediate downside level to watch, along with the 50-day moving average located marginally below.
Should we see a sustained break beneath this support zone, there’s not a lot in the way of major technical levels until just above 1.1400 where the pair has attracted buying over the past nine months. 1.1600 is a level of note in between, along with 1.1450.
Should the support zone hold, 1.1720 is where the pair topped out earlier this week. It’s the immediate level overhead of note, with the top of the prevailing range at 1.1850 the next after that.
Mirroring the price action, upside strength has all but evaporated recently with RSI (14) breaking its uptrend and now sitting around 50, while MACD has crossed the signal line from above and is pushing back towards zero. The message from the oscillators is that neither bulls nor bears have the ascendency, putting emphasis on price action to assess directional risks rather than retaining a specific bias.
The pair looks heavy right now, struggling to bounce from the support zone, but I wouldn’t be prepared to act on it unless we see a clean downside break.
Source: TradingView
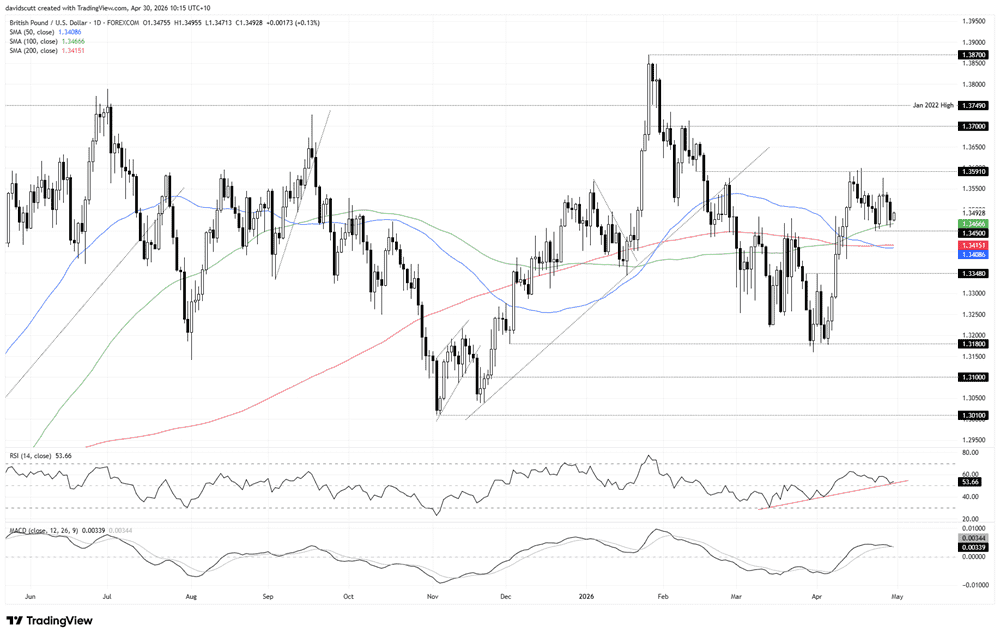
It’s a similar setup for GBP/USD which is rangebound between 1.3450 on the downside and 1.3591 on the topside. You can see the pair has attracted bids at the 100-day moving average in recent days, providing an immediate reference point to build trades around.
If the price were to bounce and break above 1.3591, 1.3700 and 1.3749 are resistance levels of note. Beneath 1.3450, the confluence of the 50 and 200-day moving averages creates a high near-term hurdle for bears, perhaps explaining why there’s been little willingness to test them in recent days, even with an increasingly bearish backdrop that would generally favour USD strength.
If we were to see a break and hold beneath this moving average zone, 1.3348 is a minor level to watch, with 1.3180 a far more important support level underneath.
The message from RSI (14) and MACD is waning upside strength, even if bulls marginally have the ascendency for now. The former continues to trend higher but is only marginally above 50, while the latter has just crossed the signal line from above but is holding in positive territory. It’s more a cautious signal for bulls rather than a green light for bears to load up.
Price action, as is the case with EUR/USD, may therefore be more informative on directional risks from here.