



Equity Indices Technical Forecast: Weekly Trade Levels
- U.S. equities are trading within well-defined monthly ranges into the close of January with breakout setups in play across the major indices
- S&P 500 marks second weekly decline (down 0.52%) with price holding just below pivotal resistance
- Nasdaq erases early-week closes to rally nearly 1.8%- monthly range set just below the 2025 high-close
- Dow trading in the middle of the monthly range, just above pivotal support- breakout to determine resumption or consolidation towards uptrend support
S&P 500 Price Chart – SPX500 Weekly
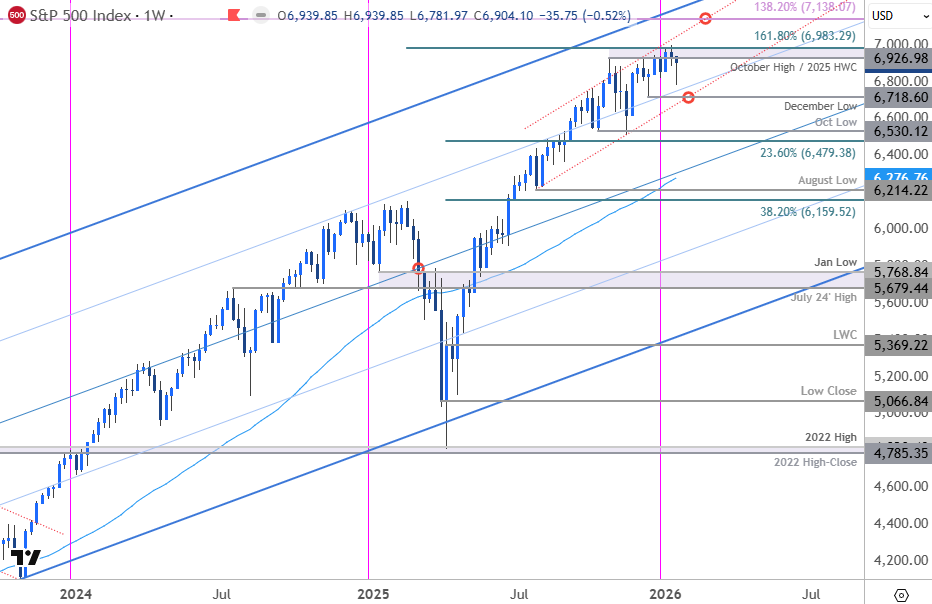
Chart Prepared by Michael Boutros, Sr. Technical Strategist; S&P 500 on TradingView
Technical Outlook: The S&P 500 has been trading just below confluent resistance since the start of the year at 6927/83- a region defined by the October high, the 2025 high-week close (HWC), and the 1.618% extension of the 2025 opening-range. The index has held below this key pivot zone for the past four-weeks with weekly RSI highlighting divergence since October. The focus remains on possible inflection off this zone with a breach / weekly close above needed to fuel the next major leg of the advance.
S&P 500 Price Chart – SPX500 Daily
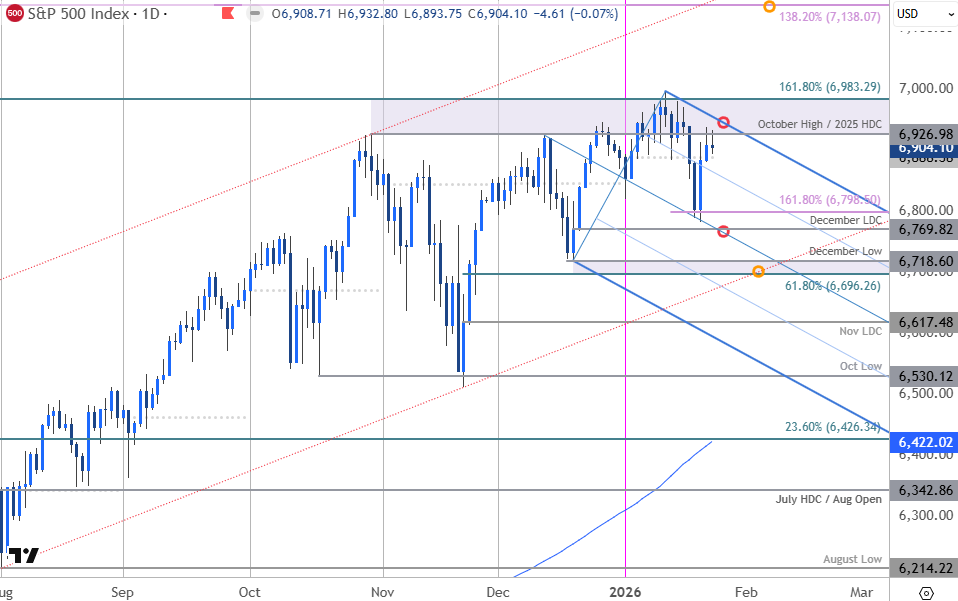
Chart Prepared by Michael Boutros, Sr. Technical Strategist; S&P 500 on TradingView
A closer look at the S&P 500 daily chart shows the index trading within the confines of a proposed near-term descending pitchfork. A decline of more than 3% off the record highs rebounded off the median-line this week with an outside-day reversal on Wednesday closing the week just below the upper parallel. Initial support rests with the 1.618% extension of the monthly decline at 6798 backed closely by the December low-day close (LDC) at 6770. Broader bullish invalidation rests at 6697-6718- a region defined by the 61.8% retracement of the November advance and the objective December low. Note that basic channel support converges on this zone into the close of the month and a break / close below would suggest a more significant high is place and a larger trend reversal is underway.
A topside breach / daily close above 6983 would be needed to mark uptrend resumption with the next technical consideration eyed at the 1.382% extension of the broader 2020 advance near 7138.
Bottom line: The S&P 500 is trading into pivotal resistance with the monthly range set just below. While the broader outlook remains constructive, the risk remains for near-term inflection off this mark with the bulls vulnerable while below. From a trading standpoint, losses would need to be limited to 6696 on pullbacks IF the index is heading higher on this stretch with a close above 6983 ultimately needed to fuel the next major leg of the advance.

Nasdaq Price Chart – NDX Weekly
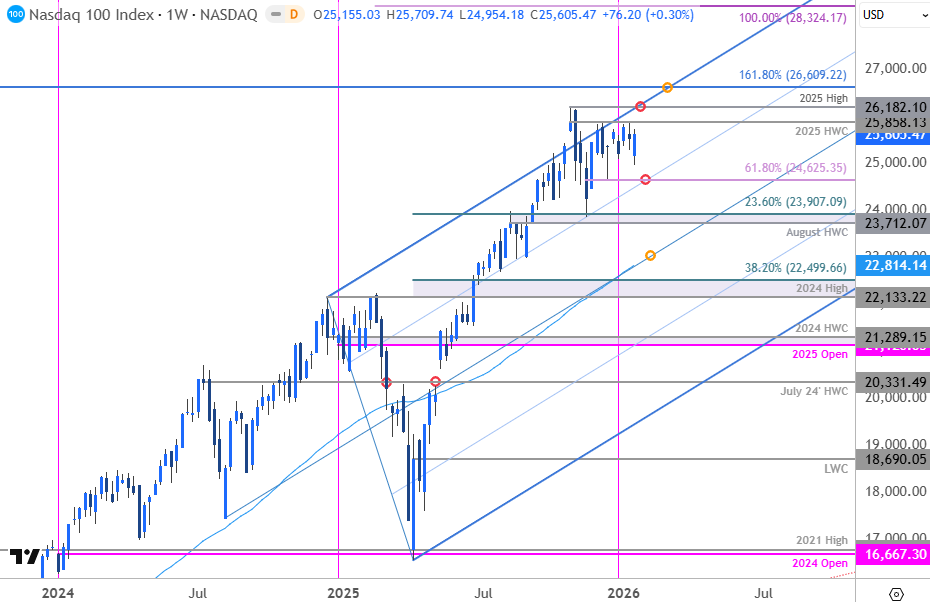
Chart Prepared by Michael Boutros, Sr. Technical Strategist; NDX on TradingView
Technical Outlook: The Nasdaq is trading within a well-defined monthly opening-range just below resistance at the 2025 high-week close (HWC) at 25858. The index has been trading within an ascending pitchfork extending off the 2025 low with a failed attempt to breakout in October highlighting the risk for a pullback towards the 75% parallel. Initial support converges on this slope over the next few weeks at the 61.8% retracement of the November rally near 24625. Losses below this threshold would threaten a deeper pullback within the broader uptrend with subsequent support seen at the August HWC and the 23.6% retracement of the 2025 rally at 23712/907. Broader bullish invalidation rests with the 52-week moving average which converges on the median-line near 22815.
Resistance remains unchanged at 25858 and is backed by the 2025 swing high at 26182 and the 1.618% extension of the broader 2020 advance at 26609. Ultimately a breach / weekly close above the upper parallel would be needed to fuel the next major leg of the rally towards the 100% extension of the 2022 advance at 28324.
Bottom line: The monthly opening-range is preserved just below resistance at the 2026 high-close. While the broader outlook remains constructive, the immediate focus remains on a breakout of this range for near-term guidance. From a trading standpoint, losses should be limited to 24625 IF price is heading higher on this stretch with a close above 25858 needed to fuel another test of the 2025 uptrend.
Dow Jones Price Chart – DJI Weekly
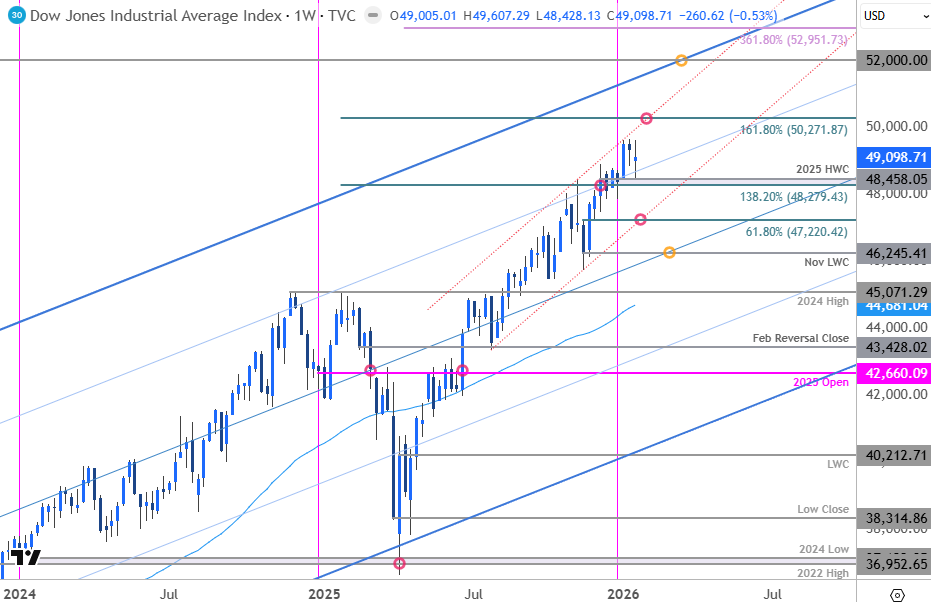
Chart Prepared by Michael Boutros, Sr. Technical Strategist; DJI on TradingView
Technical Outlook: The Dow broke through confluent resistance into the close of the year at the 75% parallel of an ascending pitchfork extending off the 2022 low. The rally exhausted into the upper parallel of the July channel (red) early in the month with the January opening-range taking shape just above support at 48279/458- a region defined by the 1.382% extension of the of the 2025 range breakout and the 2025 high-week close (HWC).
A topside breach of the range exposes the next technical consideration at the 1.6187% extension at 50272. Note that channel resistance converges on this zone over the next few weeks- look for a larger reaction there IF reached with a weekly close above needed to fuel the next major leg of the advance towards 52000.
A break below support here would threaten a deeper correction within the July uptrend towards the 61.8% retracement of the November rally at 47220- look for a larger reaction there IF reached. Losses below this threshold would suggest a more significant highs is in place and a larger reversal is underway. Subsequent support rests with the November low-week close (LWC) at 46245.
Bottom line: The monthly range is set just above support- look for the breakout to offer guidance here. From a trading standpoint, losses should be limited to 48279 IF the index is heading higher on this stretch with a break above the monthly range high needed to fuel the next leg of the advance towards channel resistance / 50272.
Federal Reserve Interest Rate Expectations
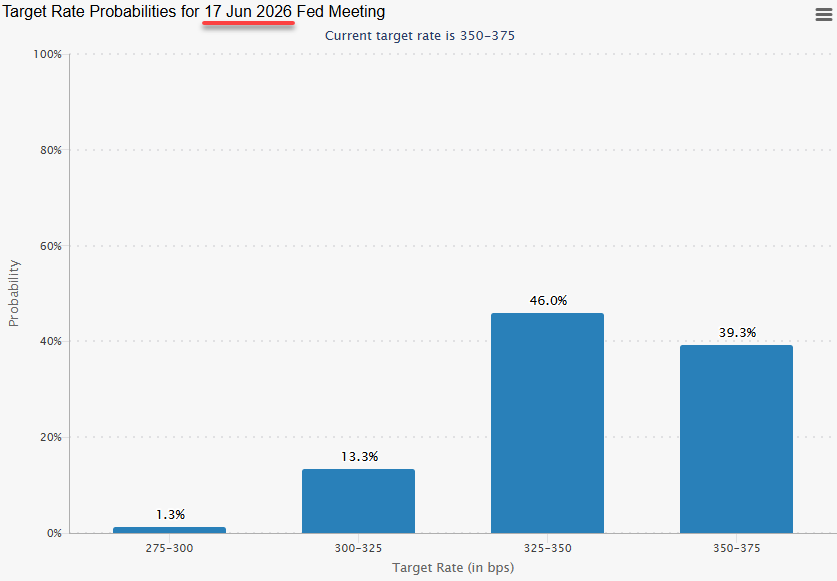
Source: FedWatch Tool, CME
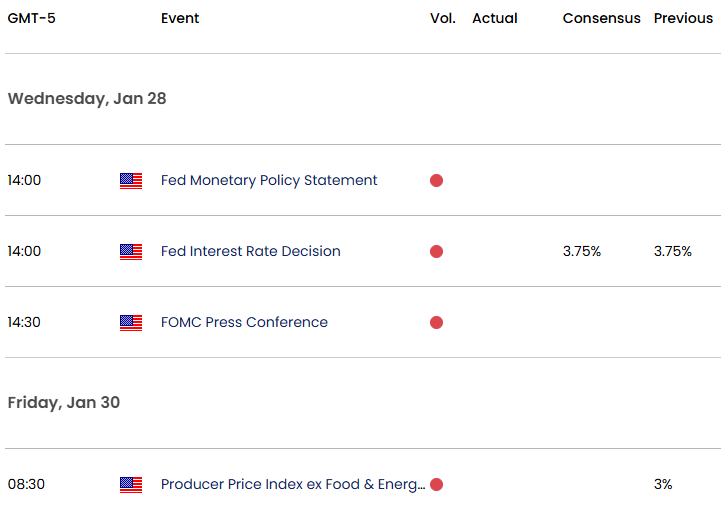
Keep in mind the FOMC rate decision is on tap next week and although the central bank is widely expected to leave rates unchanged, trader will be focused on Chair Powell's subsequent remarks. In his last presser, Powell stated that there were risks on both sides of the mandate, and with the latest weekly jobless claims release showing resiliency in the labor markets, the central bank may be more reluctant to move on rates as inflation remains well-above the 2% target.
If the commentary highlights an increased focus on the inflation front, the markets may have to reprice expectations for two rate cuts this year and could temper risk appetite in the weeks ahead. Fed fund futures are currently pricing a 71% chance that the central bank will be on hold through April with a 60% chance the first rate cut of the year will be delivered at the June rate decision. Keep an eye on this post-FOMC and watch the weekly closes here for guidance.
Key US Economic Data Releases
--- Written by Michael Boutros, Senior Technical Strategist
Follow Michael on X @MBForex






