
Equity Indices Technical Forecast: Weekly Trade Levels
- U.S. equities were higher across the board this week with the S&P 500, Nasdaq, and the Dow surging 4.3%, 6.2%, and 3.1%, respectively.
- S&P 500 breaks yearly opening-range to fresh record high- now testing initial resistance hurdles.
- Nasdaq is the top performer this week with NDX breaking the yearly opening-range to fresh record high- momentum building with resistance now in view.
- Dow rally halted at record high-week close- focus is on possible inflection off this zone in the days ahead.
- Risk sentiment remains positive after Iran reopened the Strait of Hormuz- limited event risk next week.
S&P 500 Price Chart – SPX500 Weekly
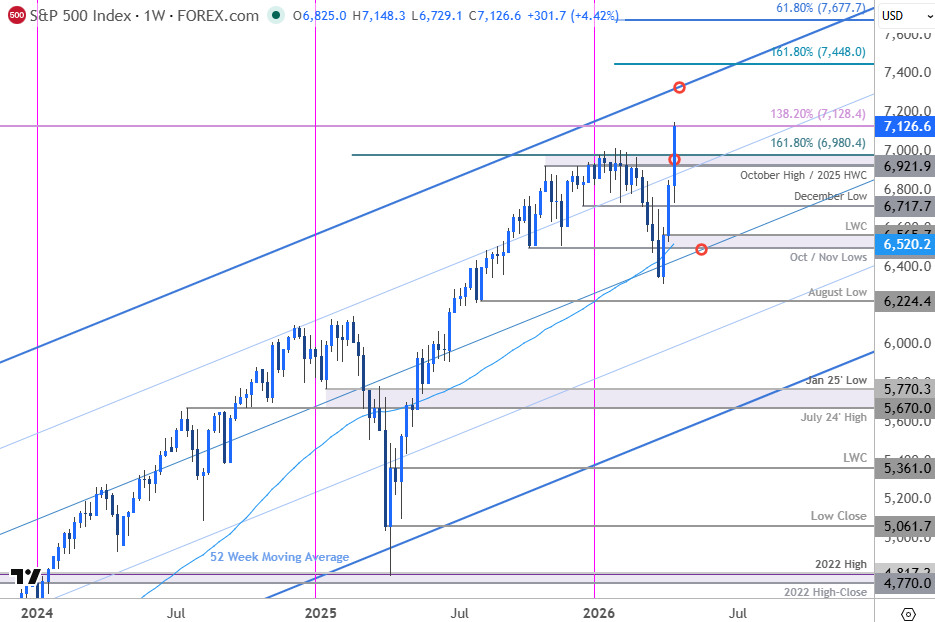
Chart Prepared by Michael Boutros, Sr. Technical Strategist; S&P 500 on TradingView
Technical Outlook: In last month’s Equity Indices Forecast we noted that the, “threat remains lower while below the 200-day moving average with a close below 6492 needed to fuel the next leg of the decline. Keep in mind that sentiment has turned over rather aggressively here and we are on the lookout for a potential exhaustion low in the weeks ahead- stay nimble here.” The SPX500 broke lower the following week with price registering an intraday low at 6310 before rebounding sharply into the close of March. The subsequent rally has now broken to fresh record highs with a third consecutive weekly advance extending than 13% off the yearly low.
Incredibly, the index has seen only one down day since that low, with the advance marking a ten-day rally on Friday. The last time the SPX accomplished this feat was in July when the 2025 yearly opening-range broke. Similarly, the index has now cleared the 2026 opening-range highs with the rally marking the largest single-week range since April and the largest single-week advance since May. This week also marks a third weekly advance of 3% or more for the first time since 1982. Note that daily RSI has extended into overbought territory marking the highest momentum reading since September. All these technical observations suggest that a major low is in place and while the outlook remains constructive, the immediate advance is now testing the initial resistance hurdles.
S&P 500 Price Chart – SPX500 Daily
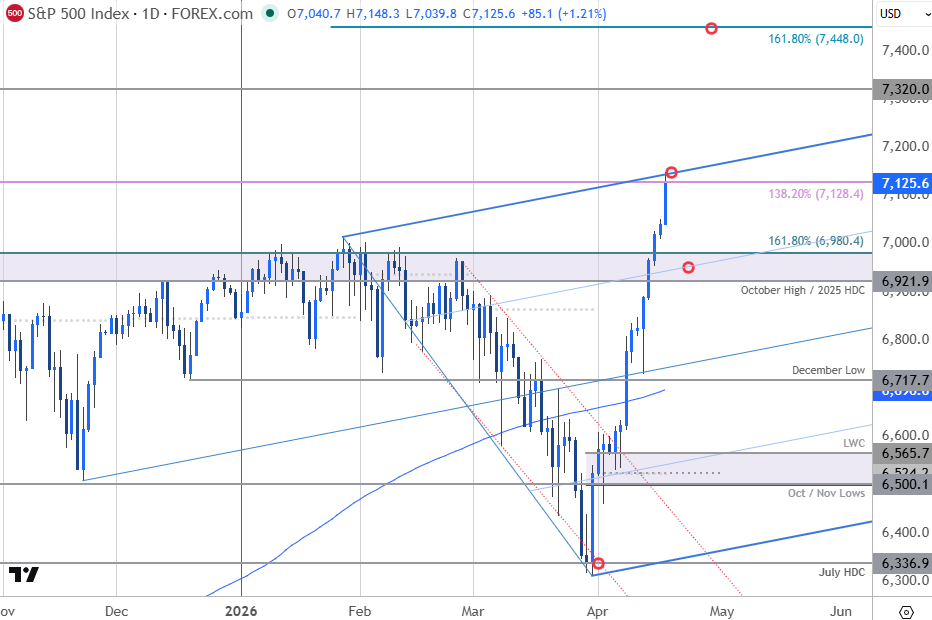
Chart Prepared by Michael Boutros, Sr. Technical Strategist; S&P 500 on TradingView
A closer look at the S&P 500 daily chart shows the index trading within the confines of a proposed ascending pitchfork extending off the March low. The upper parallel further highlights resistance near the 1.382% extension of the 2020 advance at 7128. The immediate focus is on a reaction off this mark. A topside breach / close above exposes subsequent resistance objectives near 7320 and the 1.618% extension of the 2025 range breakout at 7448.
Initial support now rests at former resistance near 6922/80- a region defined by the October high, the 2025 high-day close (HDC) and the 1.618% extension of the 2025 opening-range breakout. A break / close below this pivot zone would suggest a more significant high is in place and the recent rally was a false breakout. Subsequent support rests with the December low and the 200-day moving average near ~6697-6717.
Bottom line: The S&P 500 has broken the February downtrend and the yearly opening-range with a rally to fresh record highs now testing uptrend resistance. Risk for possible inflection off this zone near-term. From a trading standpoint, losses should be limited to 6922 IF price is heading higher on this stretch with a close above the upper parallel (~7128) needed to fuel the next major leg of the advance.

Nasdaq Price Chart – NDX Weekly
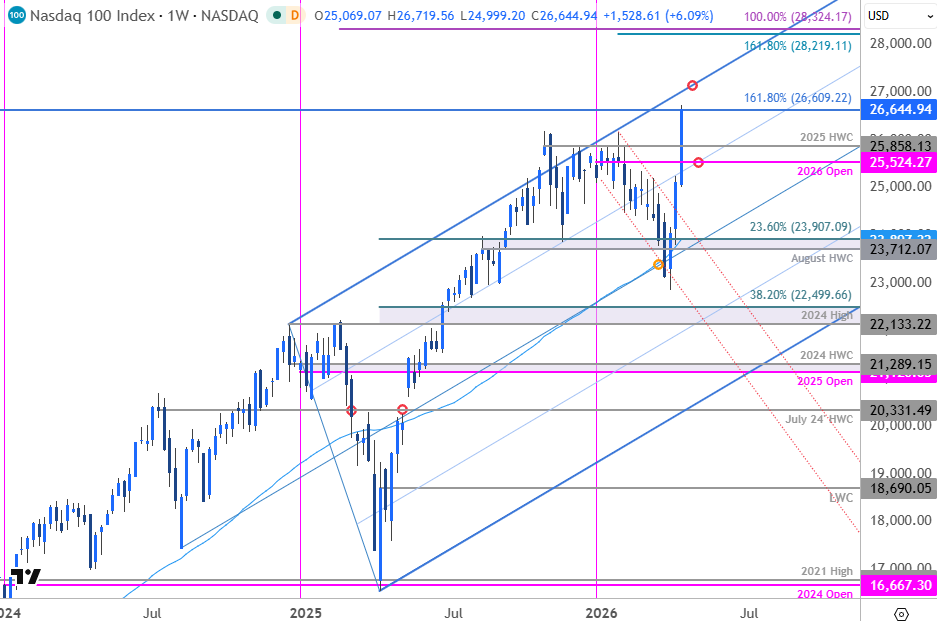
Chart Prepared by Michael Boutros, Sr. Technical Strategist; NDX on TradingView
Technical Outlook: Nasdaq was the top performer this week with NDX up 6.2% to mark a third weekly advance. A rally of nearly 17% off the yearly low takes the index into fresh record highs with the rally closing near resistance on Friday at the 1.618% extension of the broader 2020 advance at 26,609. This week’s rally marks the weekly advance since May and takes weekly momentum to the highest levels since December.
Initial support now rests with the 2025 high-week close (HWC) at 25,858 with medium-term bullish invalidation now raised to the objective yearly open at 25,524. Subsequent topside resistance objectives are eyed at the upper parallel (highlighted zone near ~27,100) and 28,219/324- a region defined by the 1.618% extension of the yearly opening-range breakout and the 100% extension of the broader 2022 advance. Look for a larger reaction there IF reached.
Bottom line: Nasdaq has broken the yearly opening-range highs and keeps the focus higher in the weeks ahead. From a trading standpoint, losses should be limited to 25,254 IF price is heading higher on this stretch with a close above the upper parallel ultimately needed to fuel the next major leg of the advance.
Dow Jones Price Chart – DJI Weekly
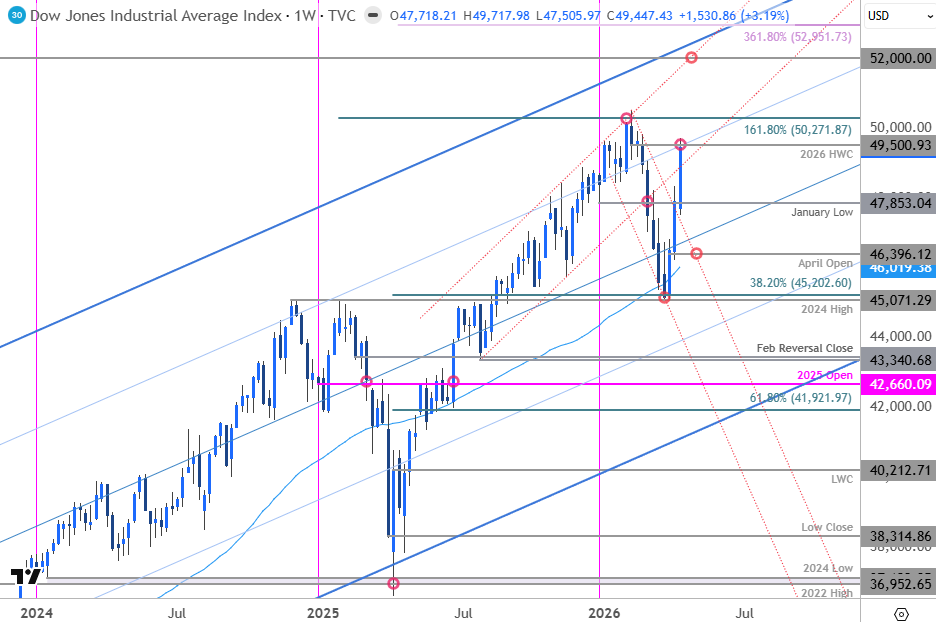
Chart Prepared by Michael Boutros, Sr. Technical Strategist; DJI on TradingView
Technical Outlook: The Dow rallied nearly 3.2% last week with the advance faltering at confluent resistance near the record high-week close (HWC) at 49,500. The index has now rallied more than 10.3% off the yearly lows and while the February downtrend has been broken, the yearly opening-range remains intact. Looking for inflection off this zone for guidance next week.
Initial support rests with the January low at 47,853 with key support now raised to the monthly open at 46,396. A weekly close above this pivot zone exposes key resistance at the 1.618% extension of the 2025 opening-range breakout at 50,271- strength beyond this threshold is needed to validate a larger breakout and mark resumption of the broader uptrend towards 52000.
Bottom line: The Dow is testing lateral resistance here on the back of a third weekly advance. From a trading standpoint, losses should be limited to 47,853 IF price is heading higher on this stretch with a close above 49,500 needed to fuel the next leg of the advance.
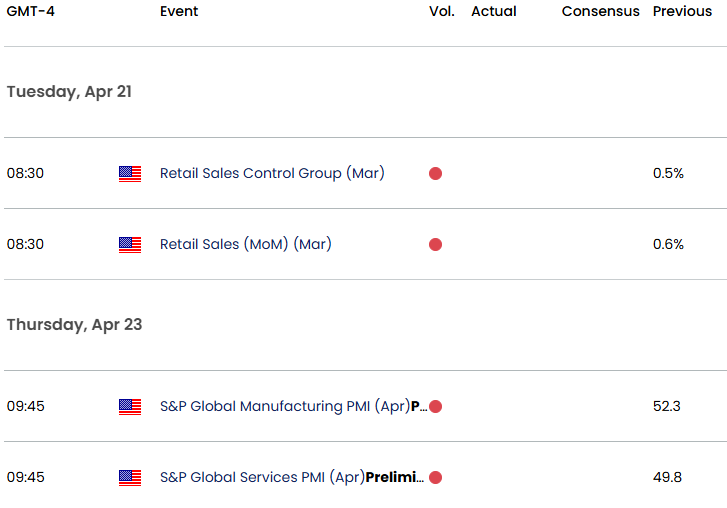
Keep in mind we get the release of release of retail sales and PMI data next week and traders will be closely monitoring the situation in Iran. As of the close on Friday, the Hormuz Strait is said to be open for business with ceasefire talks ongoing between the US and Iran. Market sentiment has shifted and barring any major negotiation breakdowns, the bulls may have legs here. Keep an eye on the headlines and watch the weekly closes for guidance.
Key US Economic Data Releases
--- Written by Michael Boutros, Senior Technical Strategist
Follow Michael on X @MBForex