

The week remains positive in the short term for the S&P 500, which is currently showing a gain of more than 1.5% over the last two trading sessions. The index has also reached the 7,500-point area for the first time, marking a new all-time high. For now, one of the key catalysts supporting demand confidence remains the optimism surrounding Trump’s trip to China, as the market is viewing the possibility of more consistent trade agreements in the short term in a positive way. As relevant updates on this event become available, this could continue to act as an additional driver supporting buying pressure in the S&P 500 over the coming sessions.

All eyes on the US-China meeting
Trump and Xi Jinping met this Thursday in Beijing for a two-hour meeting, where the main topics discussed were trade issues, key technology collaborations, and the geopolitical conflict in the Middle East. Ahead of the meeting, the White House said that the United States intends to seek an extension of the trade truce as a step toward a potentially stronger agreement in the coming months. On China’s side, there have been comments suggesting a willingness to allow key US technology companies to expand business activity in the country.
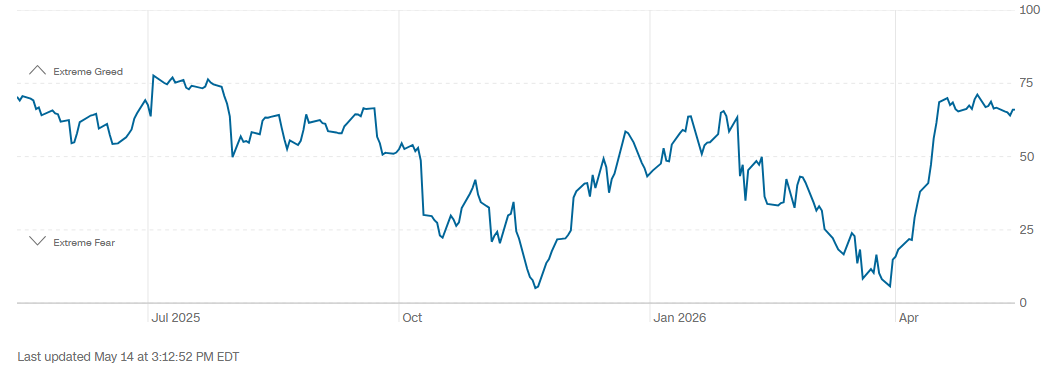
Although there are still no detailed announcements regarding the final conclusions of the meeting, the market continues to maintain an optimistic tone ahead of the end of the trip tomorrow, May 15. For now, there are no expectations of a scenario involving additional tariffs, export restrictions, or disruptions to global supply chains. In fact, the Fear and Greed Index, which reflects market confidence dynamics, has not shown any relevant short-term decline and remains stable around 66 points, within “greed” territory. This suggests that market sentiment remains stable and that optimism continues to influence short-term price action.
Source: CNN
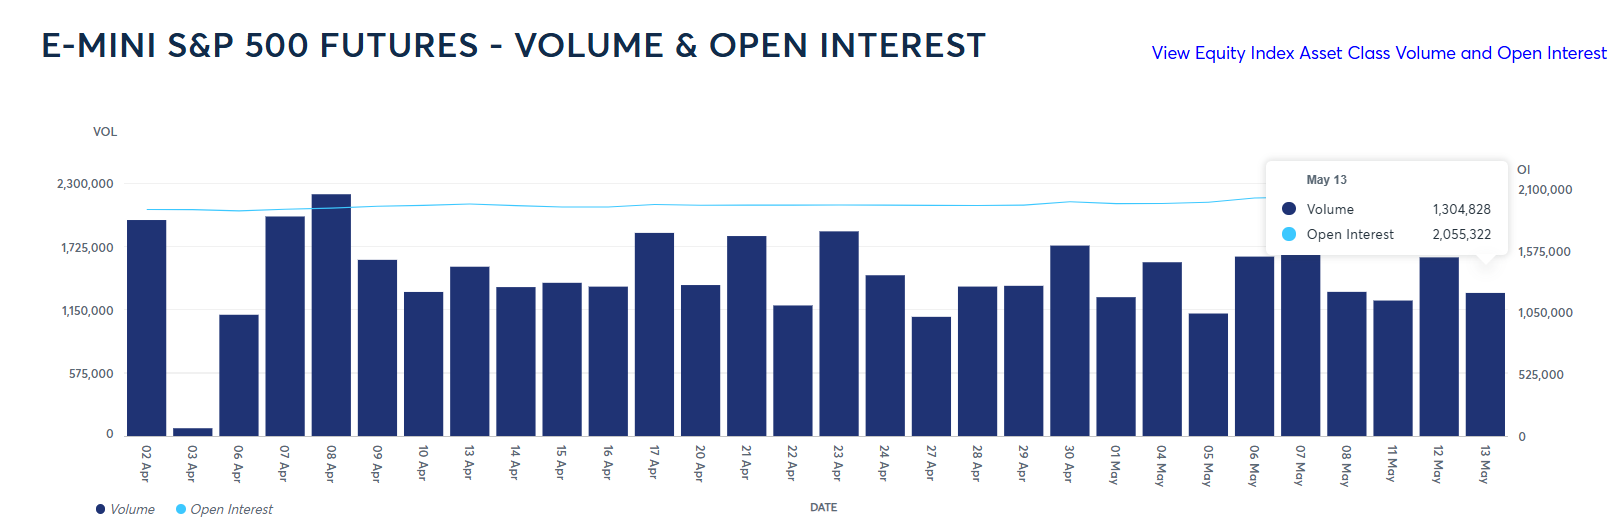
This same optimism around the expectation of stability in trade relations is also reflected in S&P 500 futures activity in the short term. Now, trading volume in SPX contracts remains above 1.3 million, which is still within the average activity seen in recent sessions. In addition, Open Interest, which measures the total number of open buy and sell contracts, has not shown relevant declines below the 2 million area. This reflects that trading activity remains solid and that, as the SPX price has continued to rise, there has not been a meaningful exit from long positions in the short term.
Source: CMEGROUP
Taking this into account, market optimism remains a relevant factor supporting consistent demand activity in the short term. As positive updates emerge from the meeting between the United States and China, particularly those pointing to greater stability in trade relations over the coming months, short-term confidence could continue to hold in stable territory. Over time, this scenario could keep supporting relevant buying pressure around the S&P 500 in the coming trading sessions.
Long-term confidence remains somewhat neutral
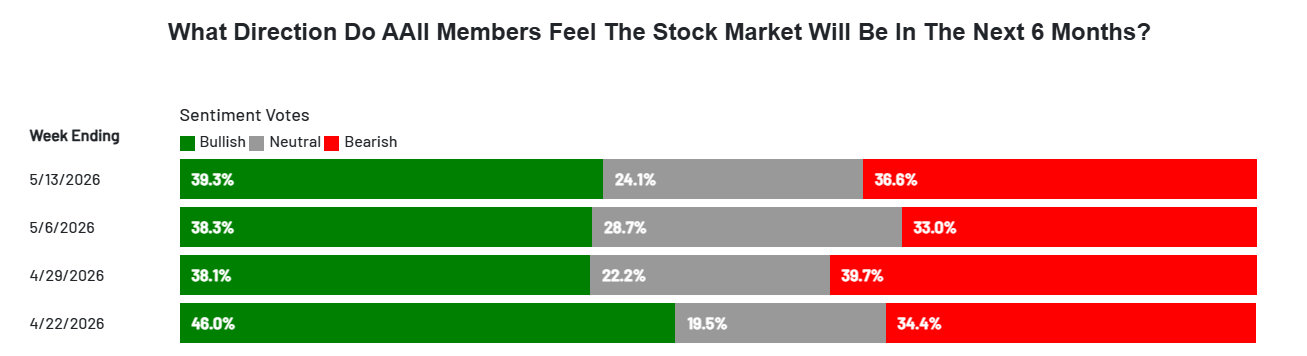
Although short-term confidence remains in positive territory, helping demand for the index and its components stay firm in recent sessions, the same cannot be said about long-term confidence. Now, the AAII Investor Sentiment Survey shows that, for the six-month outlook for the equity market, optimism stands at 39.3%, neutrality at 24.1%, and broad pessimism at 36.6%. This shows that, while optimistic sentiment has gained some relevance in recent weeks, it is not fully dominating the long-term outlook, and doubts remain over whether the current demand strength can be sustained in the coming months.
Source: AAII
This is important because, as long as long-term confidence indicators fail to show more consistent stability, it becomes harder to build a solid scenario in which demand strength can remain meaningful over the next several months. Therefore, unless optimism improves beyond what has already been seen in recent weeks, the buying pressure from the past month could begin to show signs of indecision, potentially giving way to a more neutral phase in SPX price action over the longer term.
Technical outlook for the S&P 500
Source: StoneX, Tradingview
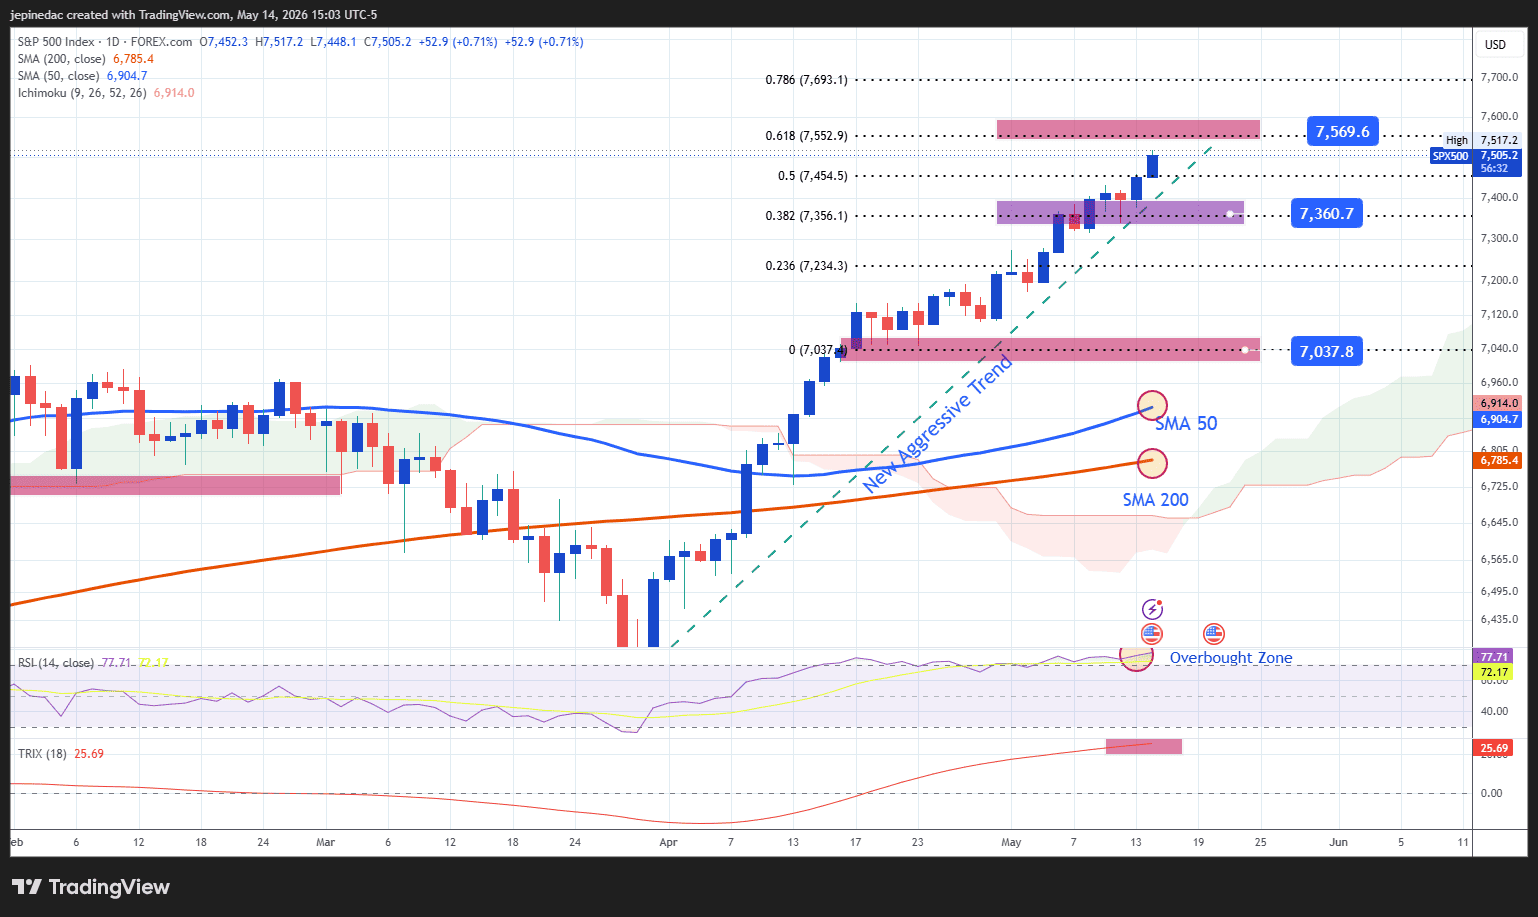
- Aggressive trendline remains intact: Recent price action has managed to maintain a relevant bullish trendline, which has been in place since the first days of April. This reflects the current dominance of bullish bias and suggests that, if no significant bearish corrections emerge, this structure could remain the dominant pattern in price action over the coming weeks.
- TRIX: The TRIX indicator continues to show highs, suggesting that the average bullish strength of long-term exponential moving averages remains relevant. This also indicates that, for now, the market’s dominant bias remains in bullish territory and could continue to be relevant in the coming weeks.
- RSI: The RSI, however, shows a slightly different picture. While the indicator remains above the neutral 50 level, it is also trading above 70, which marks overbought territory. This behavior could be warning of a potential excess of buying strength in recent sessions and may open the door to possible selling corrections over the coming sessions.
Key levels:
- 7,569 points – Relevant resistance: Given the lack of historical references, this level, which coincides with the 61.8% trend-based Fibonacci retracement, stands as the next important area to watch. Buying moves that manage to break above this level could reinforce the strength of the aggressive bullish trendline and keep it dominant in the coming sessions.
- 7,360 points – Near-term barrier: The closest retracement level to watch on the chart. This area could act as a tentative barrier in the event of potential selling corrections in the SPX over the short term.
- 7,000 points – Key support: A relevant low zone that also coincides with an important psychological level and sits below the current bullish trendline. Price action attempting to return to this level could not only invalidate the current bullish trendline but also open the door to a more relevant indecision phase over the coming weeks.
Written by Julian Pineda, CFA, CMT – Market Analyst
Follow him on: @julianpineda25