The US dollar extended its advance for a third consecutive session, reaching its highest daily close in eight weeks as stronger US economic data and persistent inflation concerns boosted expectations for higher rates. With Nonfarm Payrolls looming, traders continue to favour the greenback, weighing on major currencies, gold and Wall Street indices.
View related analysis:
- Gold Outlook: Bulls Eye Rebound, Though Futures Exposure Remains Weak
- Euro Technical Analysis: EUR/USD, EUR/JPY, EUR/AUD
- FX Futures Positioning: US Dollar Bulls Return, Yen Bears Tease MOF
- Australian Dollar Outlook: AUD/USD Extends Gains, But Pullback Risks Remain
- US Dollar Retreats on Iran Peace Deal Hopes, Though AUD/USD Bears Eye 70c
US Dollar Supported by Sticky Inflation and Hawkish Fed Signals
The US dollar index rose for a third consecutive day on Wednesday, printing its highest daily close in eight weeks. ISM Services expanded at its fastest pace in three months, rising to 54.4, while the Prices Paid component edged up to a four-year high of 71.4, reminding us that inflationary pressures remain alive and well.
On that note, Fed's Logan warned that the central bank may need to raise rates later this year. Fed funds futures now imply a 25bp hike in January with a 41.4% probability, although the curve currently prices in just a single hike. That could, of course, change if economic data and inflationary pressures continue to heat up.
Source: LSEG Workspace.
Stronger US Dollar Weighs on Risk Assets and Major Currencies
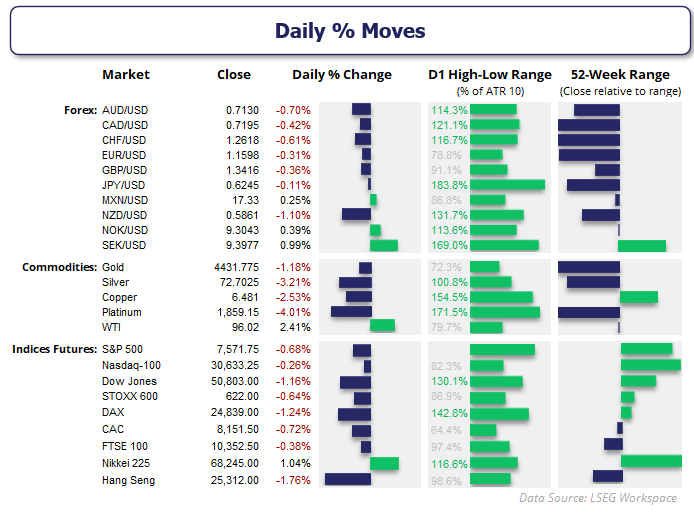
Markets were clearly taking their cue from the US dollar once again, with Wall Street indices finally pulling back from their record highs amid signs of exhaustion.
- The Dow Jones led the way lower, with futures down -1.6%. S&P 500 futures formed a bearish engulfing day and lost -0.7%, while the Nasdaq posted a modest loss of -0.26% to snap a four-day winning streak.
- EUR/USD fell for a third day in line with my bearish bias, with bears now eyeing a break below 1.16.
- NZD/USD was the weakest major after its post-RBNZ rally failed to reach 60c, with the New Zealand dollar now falling for a third consecutive day.
- AUD/USD fell -0.7%, with momentum aligning with the bearish bias outlined in recent reports. A break below 71c could open the door for a move towards 70c.
- USD/CHF rose for a third day and closed at its highest level since April 7.
- USD/CAD tagged 1.39 and made light work of invalidating last week's bearish engulfing candle, playing into the hands of Canadian dollar bears who have become increasingly bearish in recent weeks.
- USD/JPY toyed with a break above 160 – a level traders remain wary of given the MOF intervened not far from here on April 30.
- The stronger US dollar saw gold prices pull back to a four-day low, although I remain quietly optimistic that gold can hold above key support levels and stage a bounce over the near term without requiring the US dollar to roll over.

Source: ICE, TradingView
Nonfarm Payrolls Report Could Decide DXY's Next Move
For now, momentum points higher on the daily chart as we head into Friday's Nonfarm Payrolls (NFP) report. Given the backdrop of shaky ceasefires and persistent inflationary pressures, I suspect the US dollar could remain bid into NFP, with traders favouring dips. Given that the jobs report has surprised to the upside over the past couple of months despite elevated inflation pressures, there is no guarantee it will miss expectations this time either.
However, a weak set of NFP figures could topple the dollar as traders price out concerns over further Fed hikes, and that could help print a lower high beneath 100.50.

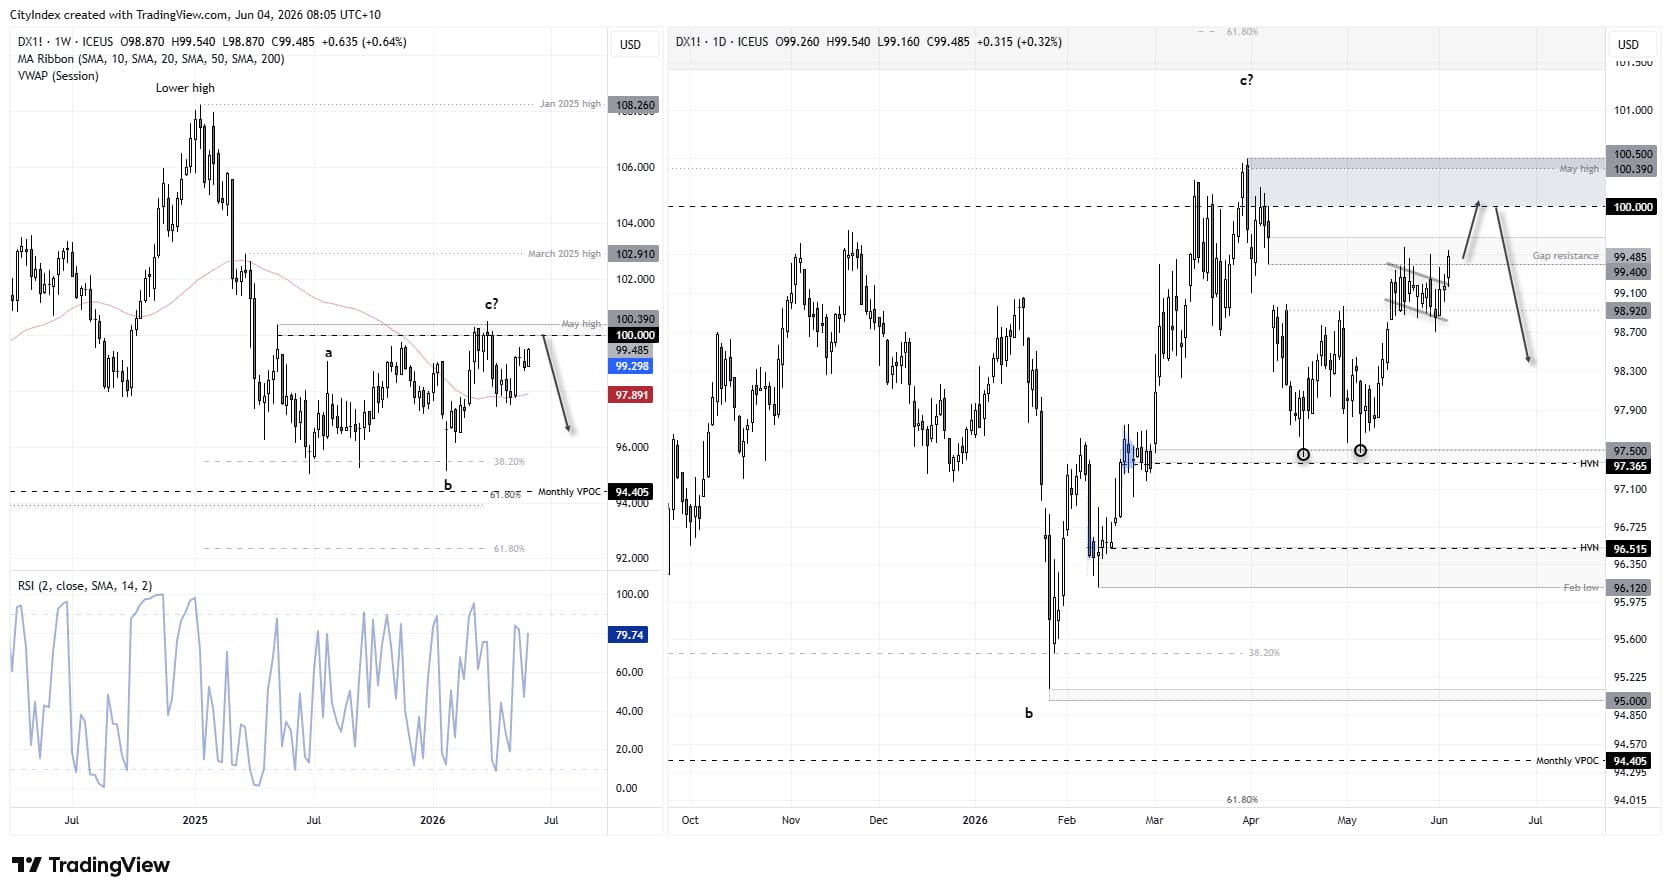
US Dollar Index (DXY) Technical Analysis
I'll retain my assumption that a significant swing high was printed on April 30, suggesting the US dollar index may have completed a wave-C correction at 100.50. Even if prices break above that high, my bias remains for USD bears to regain control and for momentum to realign with the broader selloff from the January 2025 high to the June 2025 low.
The daily chart shows the USD index is close to closing the large gap from 7 April and is within 1–2 days' trade of the 100 handle. Given momentum is turning higher from a tight consolidation amid a strong trend, I fancy its chances of 100 – a view I have held since its double bottom low formed back in early May.
Source: ICE, TradingView
For traders wanting a deeper understanding of futures positioning, I’ve also published a guide on how to read and interpret weekly COT data in forex markets.
US Dollar Index (DXY) Futures Positioning | COT Report
Now is as good a time as any to remind ourselves that futures traders were backing the US dollar rally last week. The effective net-long exposure to USD futures rose by $5.9 billion to a 6-week high of $15 billion. It was its second weekly rise, totalling an increase of $11.4 billion – or 76% of the current net-long exposure. Asset managers increased their net-long exposure to a 15-month high of 16.2k contracts, and large speculators flipped back to net-long exposure – though by a mere 850 contracts. They may be slower, but they’re in agreement with the others for now.
A sustained break above 100 would strengthen the near-term bullish case for the US dollar, although I still suspect any rally towards 100.50 ultimately provides a selling opportunity for longer-term USD bears.

Source: ICE, TradingView
View the full economic calendar
-- Written by Matt Simpson
Follow Matt on Twitter @cLeverEdge
How to trade with City Index
You can trade with City Index by following these four easy steps:
- Open an account, or log in if you’re already a customer
• Open an account in the UK
• Open an account in Australia
• Open an account in Singapore
- Search for the market you want to trade in our award-winning platform
- Choose your position and size, and your stop and limit levels
- Place the trade