The USDJPY forecast and Dow Jones outlook remain closely tied to rising US bond yields, inflation expectations, and central bank policy shifts. USDJPY is once again approaching the critical 160 resistance level, while the Dow Jones struggles near record highs ahead of NVIDIA earnings and renewed rate hike expectations.
CME Fed Watch Tool
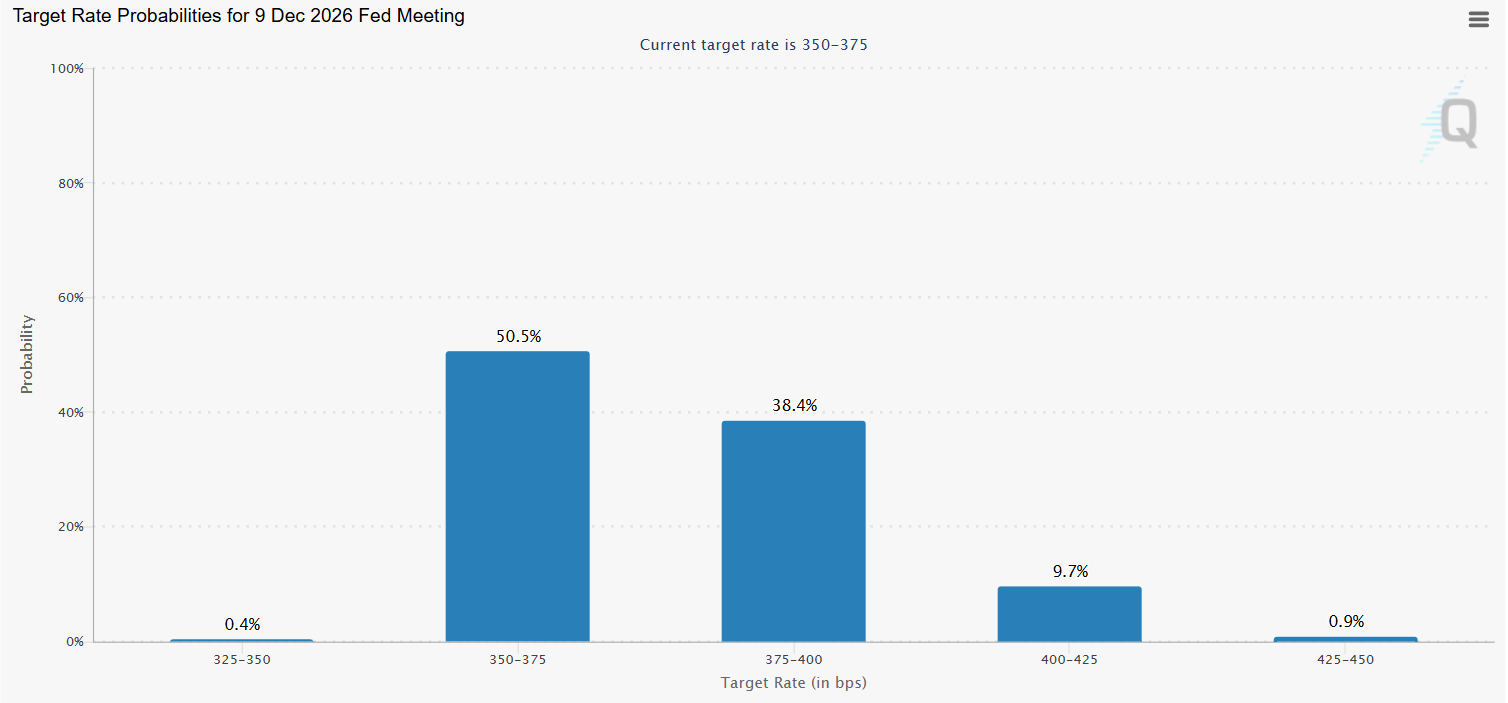
Fed rate hike expectations toward year-end have risen to nearly 40%, weighing on the broader market outlook.
The USDJPY and DJIA charts have continued leading broader market sentiment, as crude oil prices and inflation data increasingly align with elevated market valuations and shifting central bank outlooks.
Key Market Drivers
- Japanese government bond (JGB) 30Y yields are extending to fresh record highs above 4.1%
- USDJPY is trending back toward the 160 level, a long-term resistance zone dating back to the 1990s. Previous Article: USD/JPY Price Forecast: Is the One-Year Uptrend Still Valid?
- US 30-year Treasury yields are approaching the 2023 and 2025 highs above 5%
- US indices soften near record highs amid rising bond yields and growing expectations for additional Federal Reserve tightening
- NVIDIA earnings on Thursday may trigger volatility across equity markets, though Treasury yields and interest rate expectations are likely to remain the primary drivers of broader trends
Will USDJPY Break Above 160?
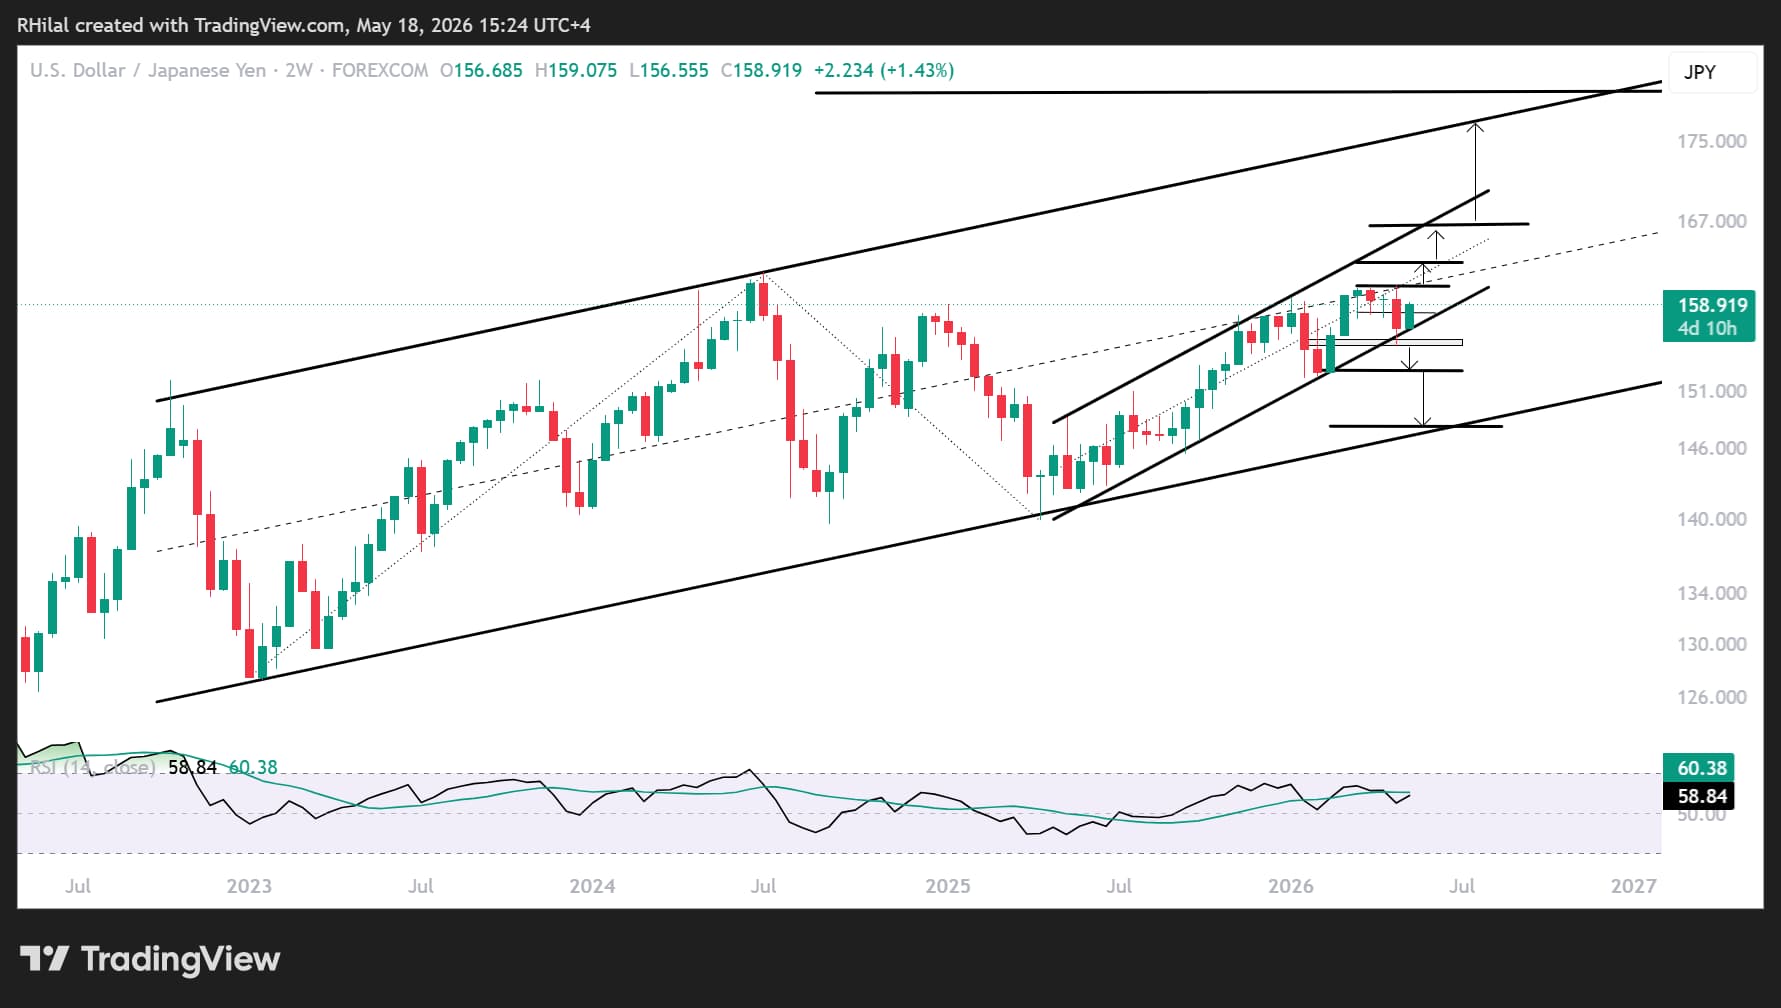
USDJPY Price Outlook: Weekly Time Frame – Log Scale
Source: Trading view
On the weekly chart, the pair continues to respect a parallel uptrend established since April 2025, holding above the 155-support zone.
This structure is now challenging the mid-zone resistance of a broader channel extending from the 2022 lows toward 2026—making this area a pivotal decision point for trend continuation or reversal, near 160
Bullish Scenario: Continuation Above 160
A sustained break and weekly close above 158–160 would confirm renewed bullish momentum. In this scenario, price action could extend toward: 166 – 174 - 180
These levels align with Fibonacci projections (0.618, 0.786, 1.0, 1.272) of the broader cycle between the 127 low (2023), 161.70 high (2024), and 140 low (2025), while also coinciding with the upper boundary of the long-term ascending channel.
Bearish Scenario: Breakdown Below 155
Failure to reclaim 160, combined with sustained pressure below the channel mid-zone, increases the probability of a downside move. A confirmed break below 155 would signal a structural shift, opening the path toward:
- 152 (yearly lows)
- 150 (psychological level)
- 147 (channel support)
Such a move would reflect a deeper repositioning in USD/JPY, potentially driven by BOJ intervention or a broader shift in dollar sentiment.
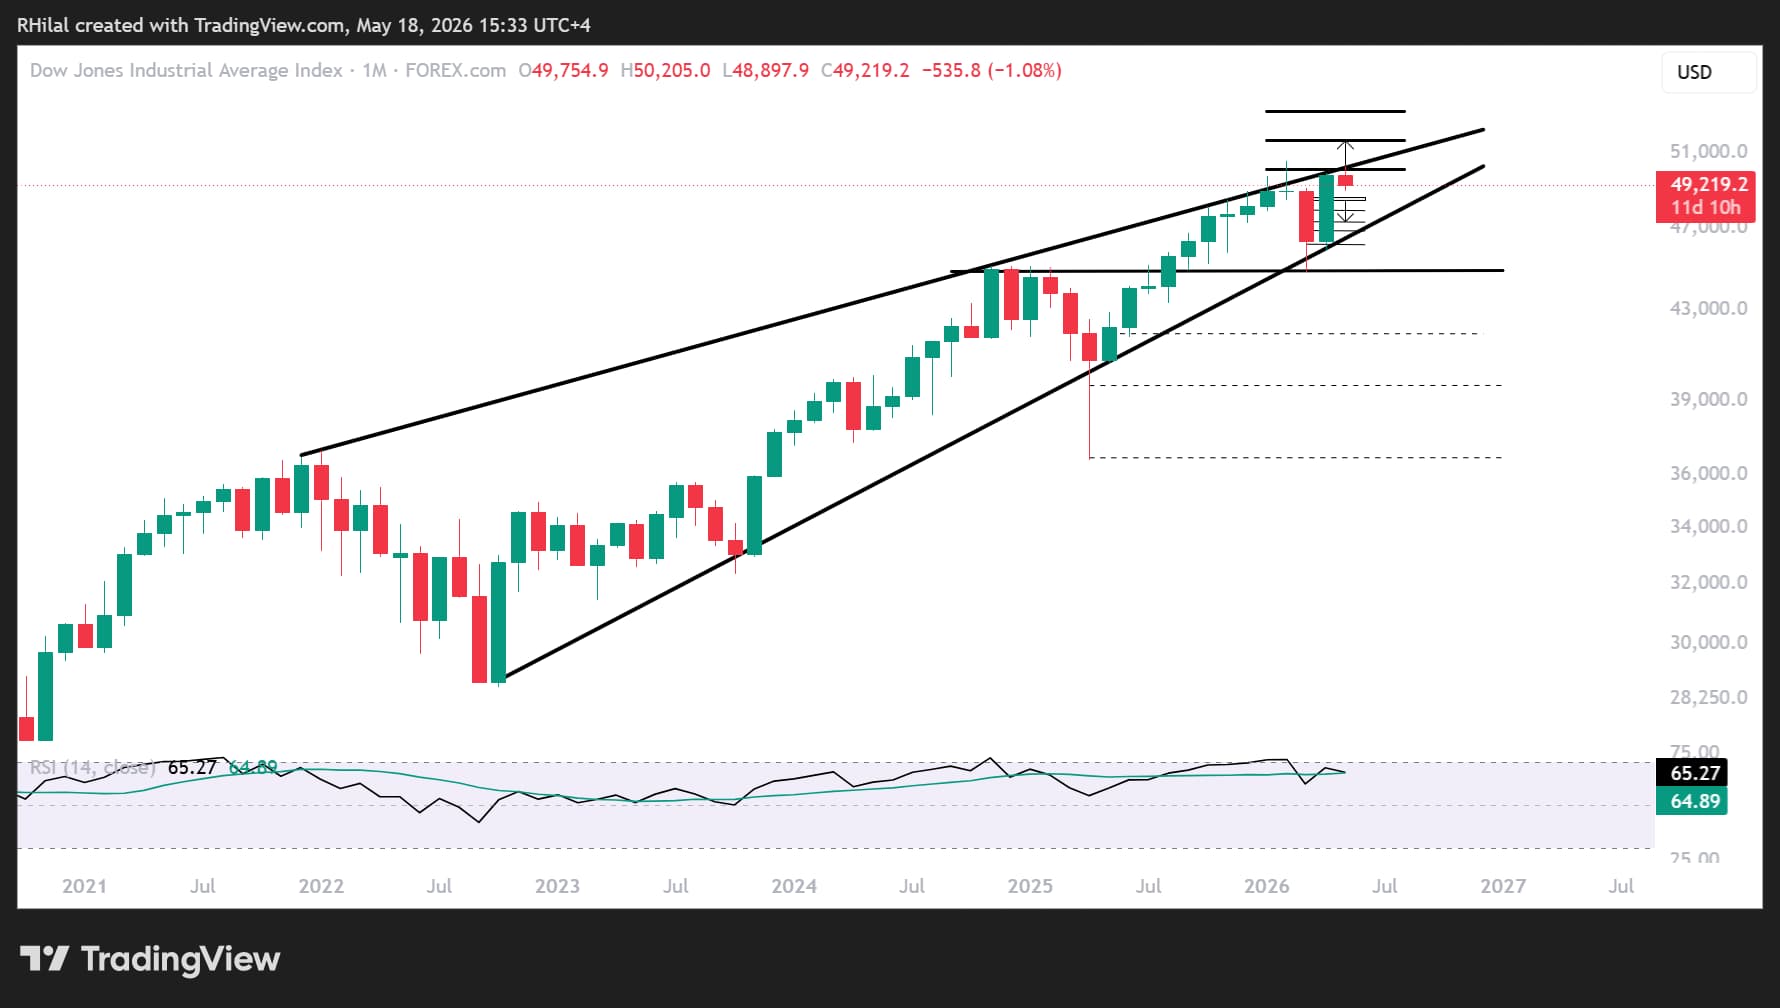
Dow Jones Forecast: Monthly Time Frame – Log Scale
Source: Trading view
The Dow Jones Industrial Average signaled early caution regarding potential pullback risks at the start of the year, as price action tested a four-year resistance trendline connecting consecutive highs since 2022.
This follows the strong rebound from the 2020 lows, forming a potential diagonal resistance structure as equity markets continue balancing growth expectations against tightening financial conditions.
Geopolitical tensions in the Middle East triggered a pullback from the 50,500 region toward the lower boundary of the consolidation range and the 2025 highs near 44,800. This was followed by another rebound toward resistance, with multiple rejections from the 50,000 zone before the latest drawdown toward 49,000.
The key question now remains: will the Dow Jones break higher, or will rising Treasury yields trigger a deeper correction in risk assets?
Key Dow Jones Levels to Watch
Bullish Scenario
A sustained close above the 49,900–50,500 resistance zone would invalidate the bearish scenario and expose the following upside targets:
- 51,200
- 52,700
Such a move would likely require softer inflation expectations, stable Treasury yields, and continued strength in large-cap technology stocks following NVIDIA earnings.
Bearish Scenario
A close below 48,500 would increase downside pressure toward:
- 47,800
- 47,300
- 46,800
This could open the door for either another rebound attempt or a broader correction across US equity markets, especially if bond yields continue climbing above recent highs.
Final Outlook
The broader market narrative continues revolving around rising crude prices and the energy market shock, bond yields, inflation expectations, and central bank policy divergence. While NVIDIA earnings may trigger short-term volatility, Treasury yields and Federal Reserve expectations remain the dominant macro drivers for both USDJPY and the Dow Jones.
USDJPY remains at a critical long-term resistance near 160, while the Dow Jones continues consolidating below the 50,000 psychological barrier. The next breakout in either direction could define market sentiment heading into the next quarter of the year.
Written by Razan Hilal, CMT
Follow on X: @Rh_waves