
Australian Technical Forecast: AUD/USD Weekly Trade Levels
- AUD/USD reversal off trend resistance now testing first major uptrend support
- The focus is on a potential inflection off this slope- key U.S. inflation data on tap next week
- Resistance 6550/65, 6650 (key), 6723 - Support 6469 (key), 6404, 6357
The Australian Dollar has come under renewed pressure, with AUD/USD falling more than 2.3% off the October highs after breaking below the monthly opening range. The decline follows a reversal off yearly uptrend resistance, with price now testing pivotal trend support. A break below the median-line would risk a deeper pullback within the broader formation, while stabilization at this slope could offer a near-term recovery. Battle lines drawn on the AUD/USD weekly technical chart.
Australian Dollar Price Chart – AUD/USD Weekly
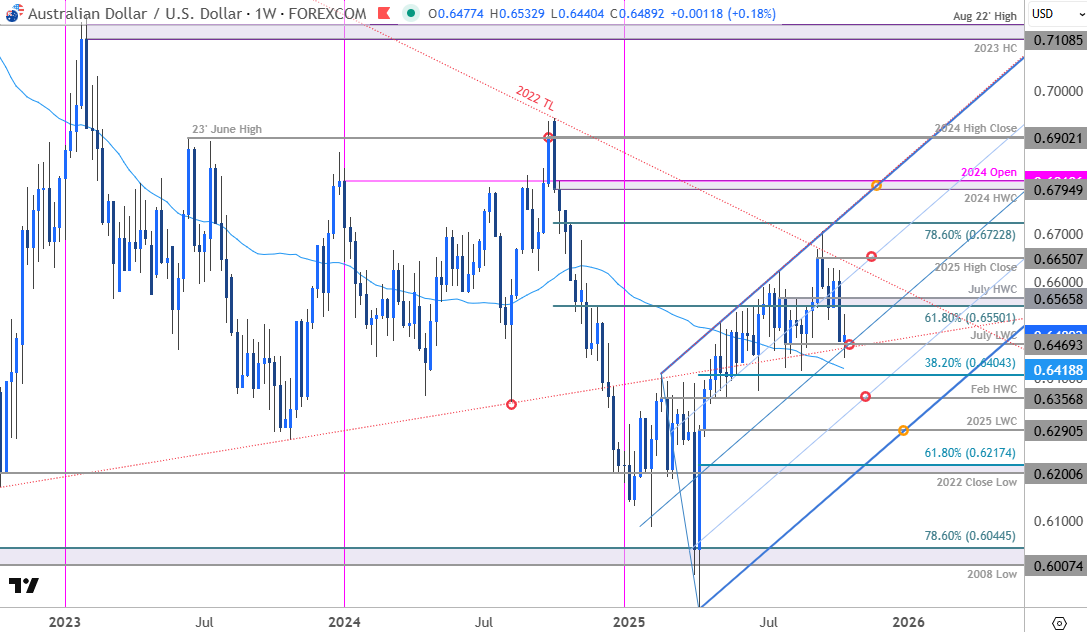
Chart Prepared by Michael Boutros, Sr. Technical Strategist; AUD/USD on TradingView
Technical Outlook: In my last Australian Dollar Forecast we noted that AUD/USD had, “reversed off uptrend resistance last month and the focus is on this pullback into lateral support. The October opening-range is taking shape just above- look for the breakout in the weeks ahead. From a trading standpoint, rallies would need to be limited to 6650 IF price is heading for a deeper correction on this stretch with a break / close below 6650 needed to charge the decline.” The monthly opening-range broke lower two-days later with Aussie plunging nearly 4% off the September / yearly high.
The decline exhausted this week into the July low-week close (LWC) a 6469. Note that this level converges on the median-line of the yearly uptrend (blue) and the 2022 trendline (red) and further highlights the technical significance of this zone in the weeks ahead. A break / weekly close below this slope is needed to suggest a larger correction is underway here with subsequent support objectives seen at the 52-week moving average (currently ~6419), the 382% retracement of the yearly range at 6404 and the February high-week close (HWC) at 6357. Broader bullish invalidation rests with 2025 LWC at 6290.
Weekly resistance is now at the 61.8% retracement of the 2024 decline / July HWC at 6550/65 and is backed by the yearly high-close at 6650. A breach / weekly close above this threshold is needed to suggest a more significant low is in place / mark resumption of the yearly uptrend with subsequent resistance objectives eyed at the 78.6% retracement at 6723 and the 2024 HWC / yearly open at 6795-6810 (both levels of interest for possible topside exhaustion / price inflection IF reached).

Bottom line: A reversal off uptrend resistance is now testing initial uptrend support and the focus is on possible inflection off this slope. From a trading standpoint, rallies should be limited to 6565 IF price is heading for a break lower on this stretch with a close below the median-line needed to fuel the next major leg of the decline.
With the economic docket light until next week’s highly anticipated U.S. inflation report (CPI). In the meantime, traders will be closely monitoring developments regarding the escalating China trade dispute and the ongoing U.S. government shutdown. Headline risk over the next few weeks will be significant ahead of the upcoming Fed rate decision on October 29. Stay nimble here and watch the weekly closes for guidance. Review my latest Australian Dollar Short-term Outlook for a closer look at the near-term AUD/USD technical trade levels.
Australia / US Economic Calendar
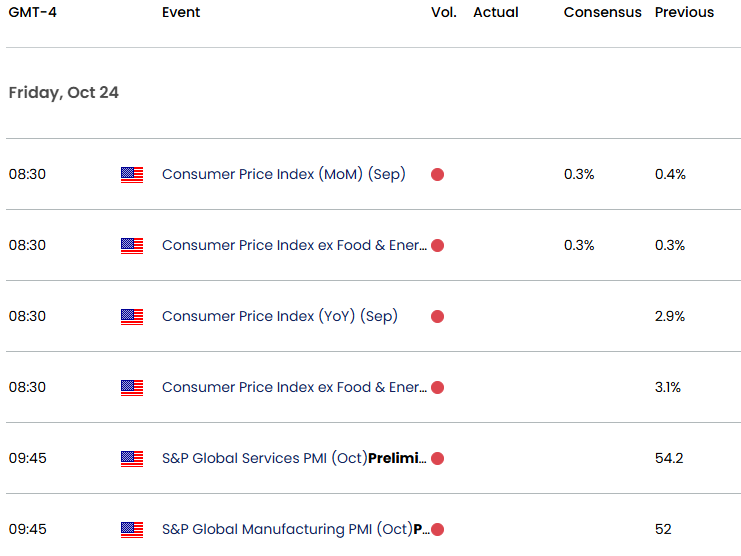
Economic Calendar - latest economic developments and upcoming event risk.
--- Written by Michael Boutros, Sr Technical Strategist
Follow Michael on X @MBForex